2. The following data are the scores of the students in an examination. Male 4 16 11 9 8 Female 2 9 Test the significance of the difference of the means between the two samples using a = 10%.
2. The following data are the scores of the students in an examination. Male 4 16 11 9 8 Female 2 9 Test the significance of the difference of the means between the two samples using a = 10%.

Glencoe Algebra 1, Student Edition, 9780079039897, 0079039898, 2018
18th Edition
ISBN:9780079039897
Author:Carter
Publisher:Carter
Chapter10: Statistics
Section10.4: Distributions Of Data
Problem 19PFA

Related questions
Question
Can you answer no. 2 ?
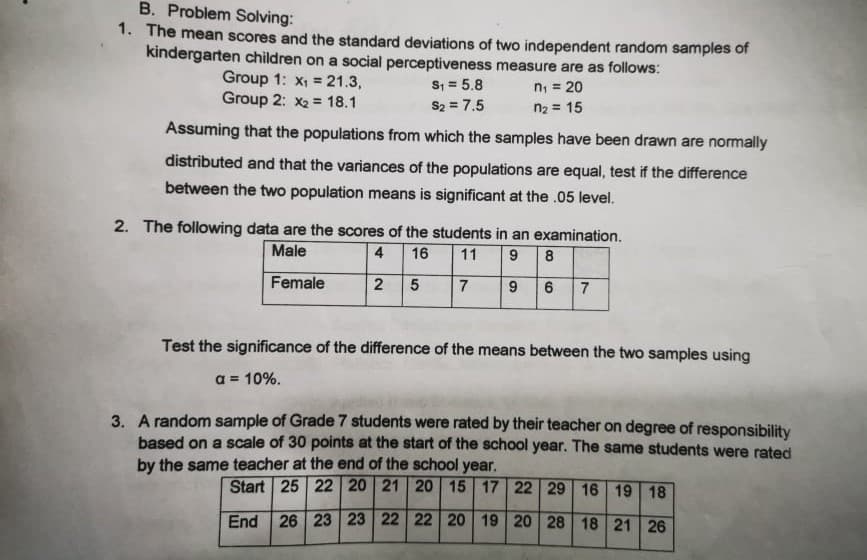
Transcribed Image Text:B. Problem Solving:
1. The mean scores and the standard deviations of two independent random samples of
kindergarten children on a social perceptiveness measure are as follows:
Group 1: x1 = 21.3,
Group 2: x2 = 18.1
S; = 5.8
S2 = 7.5
Assuming that the populations from which the samples have been drawn are normally
n; = 20
n2 = 15
distributed and that the variances of the populations are equal, test if the difference
between the two population means is significant at the .05 level.
2. The following data are the scores of the students in an examination.
4
Male
16
11
9 8
Female
7
Test the significance of the difference of the means between the two samples using
a = 10%.
3. A random sample of Grade 7 students were rated by their teacher on degree of responsibility
based on a scale of 30 points at the start of the school year. The same students were rated
by the same teacher at the end of the school year.
Start 25 22 20 21 20 15 17 22 29 16 19
18
End 26 23 23 22 22 20 19 20 28 18 21 26
Expert Solution
This question has been solved!
Explore an expertly crafted, step-by-step solution for a thorough understanding of key concepts.

This is a popular solution!

Trending now
This is a popular solution!

Step by step
Solved in 3 steps

Knowledge Booster


Learn more about
Need a deep-dive on the concept behind this application? Look no further. Learn more about this topic, statistics and related others by exploring similar questions and additional content below.Recommended textbooks for you
Glencoe Algebra 1, Student Edition, 9780079039897…
Algebra
ISBN:
9780079039897
Author:
Carter
Publisher:
McGraw Hill
Glencoe Algebra 1, Student Edition, 9780079039897…
Algebra
ISBN:
9780079039897
Author:
Carter
Publisher:
McGraw Hill