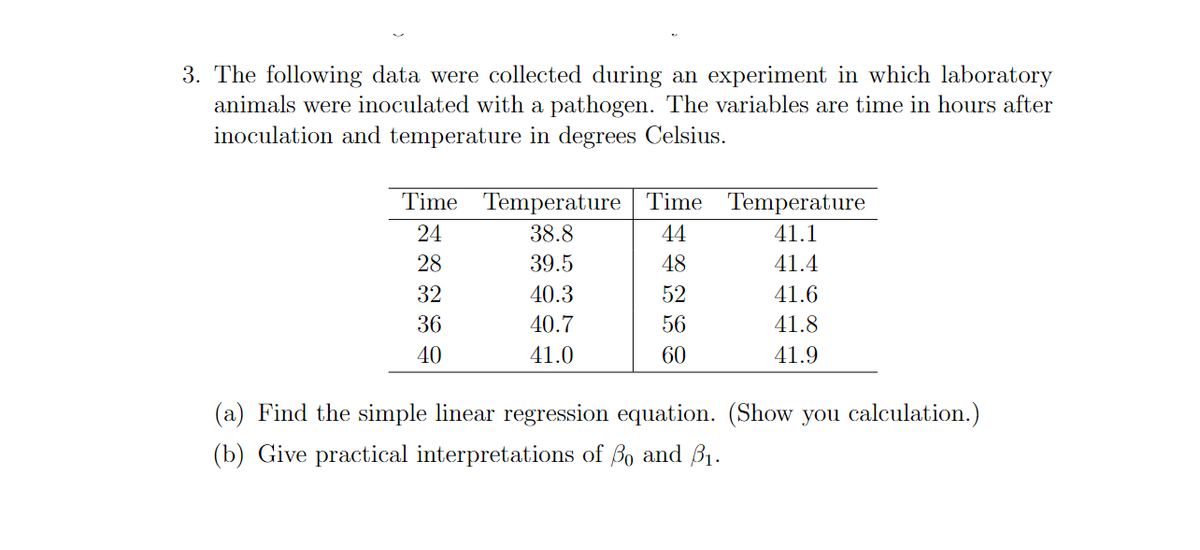
3. The following data were collected during an experiment in which laboratory animals were inoculated with a pathogen. The variables are time in hours after inoculation and temperature in degrees Celsius. Time Temperature Time Temperature 24 38.8 44 41.1 28 39.5 48 41.4 32 40.3 52 41.6 36 40.7 56 41.8 40 41.0 60 41.9 (a) Find the simple linear regression equation. (Show you calculation.) (b) Give practical interpretations of Bo and B1.
Q: with their grades. y (grade) 90 92 100 x (study hours) 24 19 28 1 85 70 20 14 76 95 15 29 7 a) Fit a…
A: Find Regression line equations from the following data, also Estimate y when x = 25.5 X Y 24…
Q: Suppose you work for a software company and you would like to estimate the market value of your…
A: The independent variable is earnings. The dependent variable is market cap. We have to predict the…
Q: Consider the following linear regression model that relates income per capita in thousand dollars of…
A: Given Information: Consider the given regression model. GDPper capitai=β0+β1PAi+ui Here,…
Q: In fitting a multiple linear regression model of the form: E(Y)=B0 +B1X1+B2X2+B3X3, if the observed…
A: Solution: Given information: n= 20 observation k= 3 independent variables SSE= 120 SST=SSyy= 500…
Q: Suppose we have the following dataset with one response to variable y and two predictor variables x,…
A: The dependent variable Y and two independent variables X1 and X2 are given as: y x1 x2 140 60…
Q: 178 5488 (a) Determine the linear regression model that will best predict the EPA fuel efficiency…
A:
Q: 1. there are two sets of data on the number of customers (in hundreds) and sales (in thousands in…
A:
Q: he following table gives information on the amount of sugar (in grams) and the calorie count in one…
A: Given data, X Y X*Y X*X 6 120 720 36 15 200 3000 225 12 150 1800 144 11 110 1210 121 8…
Q: given the information below: Row Education Income in in Years 2015 Dollars…
A: 1. The regression equation income = a + b (Education) Step-by-step procedure to obtain the…
Q: 2. Consider the following data for two variables, x and y. 32 18 15 26 у 10 20 21 16 22 a. Develop…
A: Regression analysis is used to study the relationship between two or more variables. Moreover, the…
Q: 5. а) The data showing the time required for a merchandiser to stock a grocery store shelf with a…
A: Data represents the time required for a merchandiser to stock a grocery store shelf with a soft…
Q: The following table gives information on the amount of sugar (in grams) and the calorie count in one…
A: Given regression equation is y=79.555+5.631x If x=15 then y=?
Q: 1. The relationship between energy consumption and household income was studied, yielding the…
A: The independent variable is Household income. The dependent variable is Energy consumption. We have…
Q: Using the same data as problem 2 above x y ху 2 7 4 11 5 16 8 12 10 18 Then the value of [ Select ]…
A: Formulae : i ) x¯ = ∑xn ii) y¯ = ∑yn iii) Slope ( b1 ) : iv) Y-intercept ( b0 ) :
Q: The table below shows the average temperature in New York City (NYC), measured in degrees Fahrenheit…
A:
Q: Suppose you work for a software company and you would like to estimate the market value of your…
A: The independent variable is earnings. The dependent variable is market cap. We have to find the…
Q: Fit a nonlinear regression equation of the form y = aX® to the following data: 5 1 2 3 4 2.98 4.26…
A: The power regression technique uses a dataset to determine a function, y=axb such that the data set…
Q: The average gasoline price per gallon (in cities) and the cost of a barrel of oil are shown for a…
A: a) In this case, cost of oil is the independent variable (x), and cost of gasoline is the dependent…
Q: 1. Dave Dumbledore is studying the test scores of students in an econometrics class. Only juniors…
A: Given: Dave wants to learn about the impact of different classes of students on their test schools.…
Q: The data shows that the percentage of female cigarette smokers in a certain country declined from…
A: The regression equation is f = -0.40t + 22.24, where f is the percentage of female smokers and t is…
Q: Finally, the researcher considers using regression analysis to establish a linear relationship…
A:
Q: 4. Exercise 4.4 Cascade Pharmaceuticals Company developed the folowing regression model, using…
A: The estimated regression model is Y=-1.04+0.24X1-0.27X2. So, b1=0.24 and b2=-0.27. Given that…
Q: The table below shows the average temperature in New York City (NYC), measured in degrees Fahrenheit…
A: Concept: We have given the temperature with respect to the months That is for each month the degree…
Q: 3. Consider the following regression model: Weekly Hours = Bo + B1 × Wage + uj Weekly Hours is the…
A: Given information: The regression model is given.
Q: 2) The accompanying table shows the percent of the adult population that married before age 25 in…
A: Given: From the above table X is years and Y is percent. Sum of X…
Q: 23: The accountant of Manama Corporation has collected the following data on its copy machine costs…
A: a) Plotting the points on graph from given data: From the given data the line of best fit is:…
Q: Finally, the researcher considers using regression analysis to establish a linear relationship…
A: Note: Hey there! Thank you for the question. As you have posted a question with several sub-parts,…
Q: An analyst fits the following regression model using 1,000 sample data: Profit = 30.23 + 20.62…
A: From the given information, the fitted regression line is, Profit = 30.23 + 20.62 Service Quality +…
Q: 00 00 30 40 50 60 samp_reg$Age 00 8 20 30 40 50 60 samp_reg$Age resid(test) samp_reg$In_Income -0.5…
A: The conditions for the validity of a regression analysis are that the the error are normally…
Q: Which of the following does NOT indicate a clear violation of the assumptions for linear regression…
A: In linear regression is the linear method to model the relation between dependent variable and one…
Q: 1. Consider the following data for two variables, x and y.x 22 24 26 30 35 40y 12 21 33 35 40 36a.…
A: Hello. Since your question has multiple sub-parts, we will solve first three sub-parts for you. If…
Q: The table below gives the estimated world population (in billions) for various years. 1980 1990 1997…
A: x y X - Mx Y - My (X - Mx)2 (X - Mx)(Y - My) 198019901997200020052011…
Q: The sales, in millions of pesos, of a certain company are shown in the table below. Year X Sales Y 1…
A: Given data is Year X 1 2 3 4 5 6 7 8 9 10 Sales Y 12 15 17 18 16 19 21 20 22 24
Q: 1- Find attached the following data: Year 1990 1991 1992 1993 1994 Sales 5 3 10 - Calculate the…
A: Formulas and function in Excel.
Q: 1. In the study of linear regression analysis, distinguish between the following expressions: (a)…
A: Note: Hey, since multiple questions are posted, we will answer first three question for you. If you…
Q: 26. Erica, the manager at Stellarbeans, collected data on the daily high temperature and revenue…
A:
Q: A researcher wants to study the factors affecting a person's decision to buy a car. For his study,…
A:
Q: What is the correct null hypothesis for simple linear regression? O Ho: H = 0 O Ho:p = 0 O Ho:…
A: Given that Null hypothesis=H0 , Alternate hypothesis=H1
Q: *Consider the following table, and answer the following Two questions Q8. Find the linear regression…
A: Note: According to Bartleby expert guidelines, we can answer only first question with their three…
Q: Cascade Pharmaceuticals Company developed the following regression model, using time-series data…
A: Hello thanks for your question. Since you have posted a question with multiple sub-parts, I will…
Q: The following table shows the annual number of PhD graduates in a country in various fields. Natural…
A: Solution A
Q: 2.1 Sales personnel want to further develop the model to include other variables. Merchandise…
A: Introduction to linear regression analysis:Regression analysis is a collection of statistical…
Q: Consider the following population linear regression model of individual food expenditure: Y = 50 +…
A:
Q: #1) Use these data to develop an estimated regression equation that can be used to predict annual…
A: 1) The regression analysis is conducted using EXCEL. The software procedure is given below: Enter…
Q: 2. The sales, in millions of pesos, of a certain company are shown in the table below. Year X Sales…
A: From the provided information, Year X Sales Y 1 12 2 15 3 17 4 18…
Q: Which of the following is NOT necessarily true about the interpretation of the value of b in the…
A: The regression equation is in the form of straight line y = a + bx where y =…
Q: Suppose that the table shows the COVID-19 cases and deaths in some NCR cities during the COVID-19…
A: Given data is
Q: A researcher is interested in knowing if there is a relationship between the years presented in the…
A: Let years be denoted by x and average family size be denoted by y. x y x-x y-y (x-x)(y-y) (x-x)2…
Q: 8. The sales manager of a large apartment rental complex feels the demand for apartments may be…
A:
Q: 1. The following is an image of a Cartesian diagram. y (3, 4) (5, 4) (3, 3) (6, 3) (3, 2) 2. (1, 1)…
A: Given information: The cartesian diagram is given.
Trending now
This is a popular solution!
Step by step
Solved in 3 steps with 1 images
- The following fictitious table shows kryptonite price, in dollar per gram, t years after 2006. t= Years since 2006 0 1 2 3 4 5 6 7 8 9 10 K= Price 56 51 50 55 58 52 45 43 44 48 51 Make a quartic model of these data. Round the regression parameters to two decimal places.Olympic Pole Vault The graph in Figure 7 indicates that in recent years the winning Olympic men’s pole vault height has fallen below the value predicted by the regression line in Example 2. This might have occurred because when the pole vault was a new event there was much room for improvement in vaulters’ performances, whereas now even the best training can produce only incremental advances. Let’s see whether concentrating on more recent results gives a better predictor of future records. (a) Use the data in Table 2 (page 176) to complete the table of winning pole vault heights shown in the margin. (Note that we are using x=0 to correspond to the year 1972, where this restricted data set begins.) (b) Find the regression line for the data in part ‚(a). (c) Plot the data and the regression line on the same axes. Does the regression line seem to provide a good model for the data? (d) What does the regression line predict as the winning pole vault height for the 2012 Olympics? Compare this predicted value to the actual 2012 winning height of 5.97 m, as described on page 177. Has this new regression line provided a better prediction than the line in Example 2?If we collect monthly sales over two years for N=100 stores, we should not apply a simple linear regression model directly to the data, because the observations are not independent with each other. Is this statement True or False? A) True B) False
- Cascade Pharmaceuticals Company developed the following regression model, using time-series data from the past 33 quarters, for one of its nonprescription cold remedies: Y=−1.04+0.24X1−0.27X2�=−1.04+0.24�1−0.27�2 where Y� = quarterly sales (in thousands of cases) of the cold remedy X1�1 = Cascade's quarterly advertising (× $1,000) for the cold remedy X2�2 = competitors' advertising for similar products (× $10,000) Here is additional information concerning the regression model: sb1=0.042�b1=0.042, sb2=0.070�b2=0.070, R2=0.720�2=0.720, se=1.63��=1.63, F-statistic=31.402F-statistic=31.402, and Durbin-Watson (d) statistic=0.499Durbin-Watson (d) statistic=0.499. Which of the independent variables (if any) appears to be statistically significant (at the 0.05 level) in explaining sales of the cold remedy? (Hint: t0.05/2,33 - 3=2.042�0.05/2,33 - 3=2.042.) Check all that apply. X1�1 X2�2 What proportion of the total variation in sales is explained by the regression…The following table shows the annual number of PhD graduates in a country in various fields. NaturalSciences Engineering SocialSciences Education 1990 70 10 60 30 1995 130 40 100 50 2000 330 130 280 140 2005 490 370 460 210 2010 590 550 830 520 2012 690 590 1,000 900 (a) With x = the number of social science doctorates and y = the number of education doctorates, use technology to obtain the regression equation. (Round coefficients to three significant digits.) y(x) =The following table shows the annual number of PhD graduates in a country in various fields. NaturalSciences Engineering SocialSciences Education 1990 70 10 60 30 1995 130 40 120 40 2000 330 130 280 120 2005 490 370 460 210 2010 590 550 830 520 2012 690 590 1,000 900 (a)With x = the number of social science doctorates and y = the number of education doctorates, use technology to obtain the regression equation. (Round coefficients to three significant digits.) y(x) =
- The following are data on the average weekly profits(in $1,000) of five restaurants, their seating capacities, andthe average daily traffic (in thousands of cars) that passestheir locations: Seating Traffic Weekly netcapacity count profitx1 x2 y120 19 23.8200 8 24.2150 12 22.0180 15 26.2240 16 33.5 (a) Assuming that the regression is linear, estimate β0, β1,and β2.(b) Use the results of part (a) to predict the averageweekly net profit of a restaurant with a seating capacityof 210 at a location where the daily traffic count averages14,000 cars.The following table shows the annual number of PhD graduates in a country in various fields. NaturalSciences Engineering SocialSciences Education 1990 70 10 70 30 1995 130 40 110 50 2000 330 130 280 140 2005 490 370 460 210 2010 590 550 830 520 2012 690 590 1,000 900 (a) With x = the number of social science doctorates and y = the number of education doctorates, use technology to obtain the regression equation. (Round coefficients to three significant digits.) y(x) = Graph the associated points and regression line. (b) What does the slope tell you about the relationship between the number of social science doctorates and the number of education doctorates? The slope tells us the increase in the number of social science doctorates for each additional education doctorate.The slope tells us the increase in the number of education doctorates for each additional social science doctorate. The slope tells us the decrease in the number…The following table shows the annual number of PhD graduates in a country in various fields. NaturalSciences Engineering SocialSciences Education 1990 70 10 60 30 1995 130 40 120 50 2000 330 130 280 140 2005 490 370 460 210 2010 590 550 830 520 2012 690 590 1,000 900 (a) With x = the number of social science doctorates and y = the number of education doctorates, use technology to obtain the regression equation. (Round coefficients to three significant digits.) y(x) = Graph the associated points and regression line. (b) What does the slope tell you about the relationship between the number of social science doctorates and the number of education doctorates? The slope tells us the increase in the number of education doctorates for each additional social science doctorate.The slope tells us the decrease in the number of education doctorates for each additional social science doctorate. The slope tells us the increase in the number…
- Cascade Pharmaceuticals Company developed the following regression model, using time-series data from the past 33 quarters, for one of its nonprescription cold remedies:Y = -1:04 + 0:24X1 - 0:27X2where Y = quarterly sales (in thousands of cases) of the cold remedyX1 = Cascade’s quarterly advertising (× $1,000) for the cold remedyX2 = competitors’ advertising for similar products (× $10,000)Here is additional information concerning the regression model:sb1 = 0:032 sb2 = 0:070R2 = 0:64 se = 1:63 F-statistic = 31:402Durbin-Watson (d) statistic = 0.4995a. Which of the independent variables (if any) appears to be statistically significant (at the 0.05 level) in explaining sales of the cold remedy?b. What proportion of the total variation in sales is explained by the regression equation?c. Perform an F-test (at the 0.05 level) of the overall explanatory power of the model.d. What additional statistical information (if any) would you find useful in the evaluation of this model?The following table shows the annual number of PhD graduates in a country in various fields. NaturalSciences Engineering SocialSciences Education 1990 70 10 60 30 1995 130 40 100 50 2000 330 130 280 120 2005 490 370 460 210 2010 590 550 830 520 2012 690 590 1,000 900 (a) With x = the number of social science doctorates and y = the number of education doctorates, use technology to obtain the regression equation. (Round coefficients to three significant digits.) y(x) = What does the slope tell you about the relationship between the number of social science doctorates and the number of education doctorates? The slope tells us the increase in the number of education doctorates for each additional social science doctorate. The slope tells us the decrease in the number of social science doctorates for each additional education doctorate. The slope tells us the increase in the number of social science doctorates for each additional education doctorate.…The operations manager of a musical instrument distributor feels that the demand for Bass Drums may be related to the number of television appearances by the popular rick group Green Shades during the previous month. The manager has collected the data shown in the following table. Demand for Bass Drums 3 6 7 5 10 8 Green Shades TV appearances 3 4 7 6 8 5 Develop the linear regression equation to forecast. Forecast demand for Bass Drums when Green Shades’ TV appearances are 10. Compute MSE and standard deviation for Problem 8.