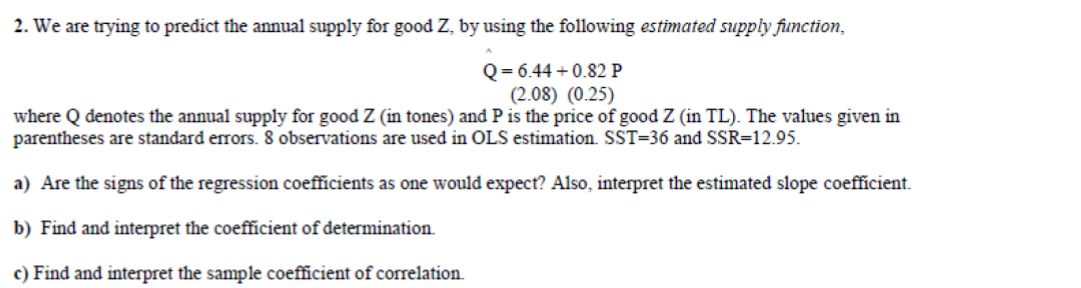
2. We are trying to predict the annual supply for good Z, by using the following estimated supply function, Q= 6.44 + 0.82 P (2.08) (0.25) where Q denotes the annual supply for good Z (in tones) and P is the price of good Z (in TL). The values given in parentheses are standard errors. 8 observations are used in OLS estimation. SST=36 and SSR=12.95. a) Are the signs of the regression coefficients as one would expect? Also, interpret the estimated slope coefficient. b) Find and interpret the coefficient of determination. c) Find and interpret the sample coefficient of correlation.


Correlation
Correlation defines a relationship between two independent variables. It tells the degree to which variables move in relation to each other. When two sets of data are related to each other, there is a correlation between them.
Linear Correlation
A correlation is used to determine the relationships between numerical and categorical variables. In other words, it is an indicator of how things are connected to one another. The correlation analysis is the study of how variables are related.
Regression Analysis
Regression analysis is a statistical method in which it estimates the relationship between a dependent variable and one or more independent variable. In simple terms dependent variable is called as outcome variable and independent variable is called as predictors. Regression analysis is one of the methods to find the trends in data. The independent variable used in Regression analysis is named Predictor variable. It offers data of an associated dependent variable regarding a particular outcome.

Step by step
Solved in 2 steps


