3) Suppose that in the Bay of Fundy, the mean high tide at a particular harbor is 5.4 m above mean sea level with a coefficient of variation of 20% and assume that this is normally distributed. For simplicity, assume that there are two high tides per day and that a year is made up of twelve 30-day months. a) Determine the asymptotic distribution of the monthly maximum tide height at the harbor (ie. specify the form of the distribution and its parameters). b) Using the results of part (a), derive the corresponding distribution for the 50-year maximum tide height and determine the 50-year most probable maximum tide height.
3) Suppose that in the Bay of Fundy, the mean high tide at a particular harbor is 5.4 m above mean sea level with a coefficient of variation of 20% and assume that this is normally distributed. For simplicity, assume that there are two high tides per day and that a year is made up of twelve 30-day months. a) Determine the asymptotic distribution of the monthly maximum tide height at the harbor (ie. specify the form of the distribution and its parameters). b) Using the results of part (a), derive the corresponding distribution for the 50-year maximum tide height and determine the 50-year most probable maximum tide height.

MATLAB: An Introduction with Applications
6th Edition
ISBN:9781119256830
Author:Amos Gilat
Publisher:Amos Gilat
Chapter1: Starting With Matlab
Section: Chapter Questions
Problem 1P

Related questions
Question
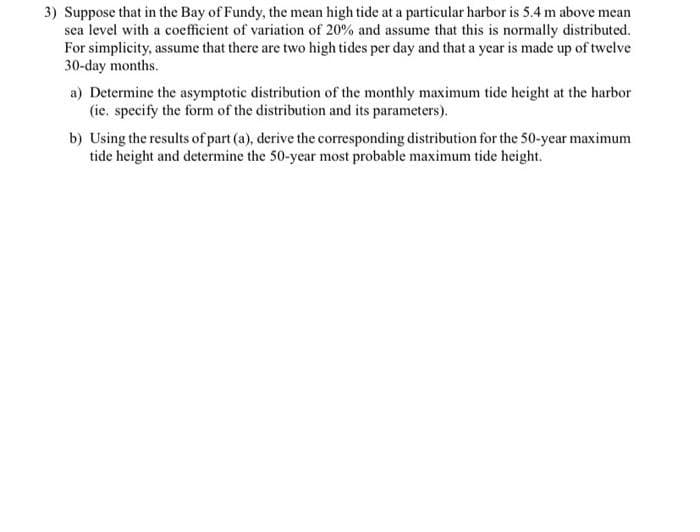
Transcribed Image Text:3) Suppose that in the Bay of Fundy, the mean high tide at a particular harbor is 5.4 m above mean
sea level with a coefficient of variation of 20% and assume that this is normally distributed.
For simplicity, assume that there are two high tides per day and that a year is made up of twelve
30-day months.
a) Determine the asymptotic distribution of the monthly maximum tide height at the harbor
(ie. specify the form of the distribution and its parameters).
b) Using the results of part (a), derive the corresponding distribution for the 50-year maximum
tide height and determine the 50-year most probable maximum tide height.
Expert Solution
This question has been solved!
Explore an expertly crafted, step-by-step solution for a thorough understanding of key concepts.

Step by step
Solved in 2 steps with 1 images

Recommended textbooks for you
MATLAB: An Introduction with Applications
Statistics
ISBN:
9781119256830
Author:
Amos Gilat
Publisher:
John Wiley & Sons Inc

Probability and Statistics for Engineering and th…
Statistics
ISBN:
9781305251809
Author:
Jay L. Devore
Publisher:
Cengage Learning

Statistics for The Behavioral Sciences (MindTap C…
Statistics
ISBN:
9781305504912
Author:
Frederick J Gravetter, Larry B. Wallnau
Publisher:
Cengage Learning
MATLAB: An Introduction with Applications
Statistics
ISBN:
9781119256830
Author:
Amos Gilat
Publisher:
John Wiley & Sons Inc
Probability and Statistics for Engineering and th…
Statistics
ISBN:
9781305251809
Author:
Jay L. Devore
Publisher:
Cengage Learning
Statistics for The Behavioral Sciences (MindTap C…
Statistics
ISBN:
9781305504912
Author:
Frederick J Gravetter, Larry B. Wallnau
Publisher:
Cengage Learning

Elementary Statistics: Picturing the World (7th E…
Statistics
ISBN:
9780134683416
Author:
Ron Larson, Betsy Farber
Publisher:
PEARSON

The Basic Practice of Statistics
Statistics
ISBN:
9781319042578
Author:
David S. Moore, William I. Notz, Michael A. Fligner
Publisher:
W. H. Freeman

Introduction to the Practice of Statistics
Statistics
ISBN:
9781319013387
Author:
David S. Moore, George P. McCabe, Bruce A. Craig
Publisher:
W. H. Freeman