3. The difference-in-differences estimator I Suppose a new policy was implemented in the state of Ohio in 2007 that greatly reduced the cost of filing for a divorce, both in terms of monetary fees and paperwork. In the neighboring state of Pennsylvania, suppose the cost of filing for divorce has not changed from before 2007 to after 2007. You have collected two cross sections of divorce data from the years 2005 and 2009, for a random set of counties in both states. Suppose you propose the following regression model, with no additional factors controlled for, to study how the new policy has influenced the number of divorces in the treatment group (the state of Ohio) versus the control group (the state of Pennsylvania):
3. The difference-in-differences estimator I Suppose a new policy was implemented in the state of Ohio in 2007 that greatly reduced the cost of filing for a divorce, both in terms of monetary fees and paperwork. In the neighboring state of Pennsylvania, suppose the cost of filing for divorce has not changed from before 2007 to after 2007. You have collected two cross sections of divorce data from the years 2005 and 2009, for a random set of counties in both states. Suppose you propose the following regression model, with no additional factors controlled for, to study how the new policy has influenced the number of divorces in the treatment group (the state of Ohio) versus the control group (the state of Pennsylvania):

Glencoe Algebra 1, Student Edition, 9780079039897, 0079039898, 2018
18th Edition
ISBN:9780079039897
Author:Carter
Publisher:Carter
Chapter10: Statistics
Section: Chapter Questions
Problem 13PT

Related questions
Question
5
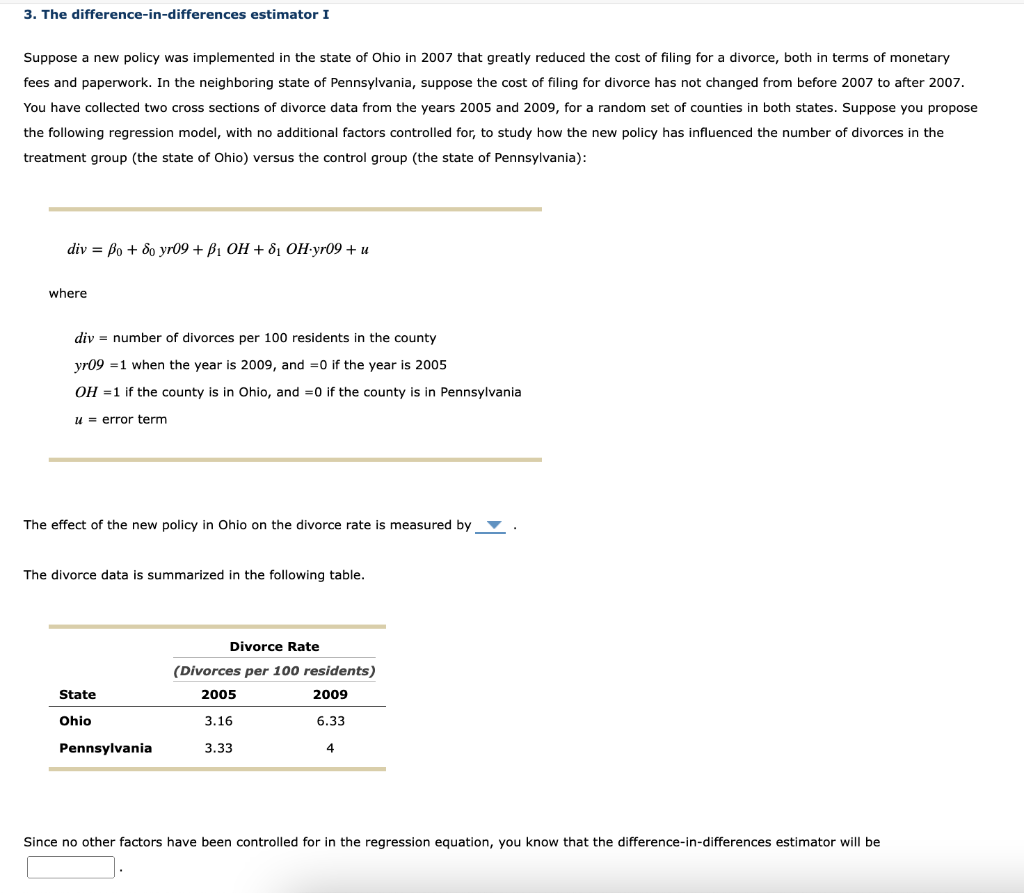
Transcribed Image Text:3. The difference-in-differences estimator I
Suppose a new policy was implemented in the state of Ohio in 2007 that greatly reduced the cost of filing for a divorce, both in terms of monetary
fees and paperwork. In the neighboring state of Pennsylvania, suppose the cost of filing for divorce has not changed from before 2007 to after 2007.
You have collected two cross sections of divorce data from the years 2005 and 2009, for a random set of counties in both states. Suppose you propose
the following regression model, with no additional factors controlled for, to study how the new policy has influenced the number of divorces in the
treatment group (the state of Ohio) versus the control group (the state of Pennsylvania):
div = Bo + do yr09 + B₁ OH +8₁ OH-yr09 + u
where
div number of divorces per 100 residents in the county
yr09 1 when the year is 2009, and =0 if the year is 2005
OH = 1 if the county is in Ohio, and =0 if the county is in Pennsylvania
u error term
The effect of the new policy in Ohio on the divorce rate is measured by .
The divorce data is summarized in the following table.
State
Ohio
Pennsylvania
Divorce Rate
(Divorces per 100 residents)
2005
2009
3.16
6.33
3.33
4
Since no other factors have been controlled for in the regression equation, you know that the difference-in-differences estimator will be
Expert Solution
This question has been solved!
Explore an expertly crafted, step-by-step solution for a thorough understanding of key concepts.

Step by step
Solved in 3 steps

Recommended textbooks for you
Glencoe Algebra 1, Student Edition, 9780079039897…
Algebra
ISBN:
9780079039897
Author:
Carter
Publisher:
McGraw Hill

College Algebra (MindTap Course List)
Algebra
ISBN:
9781305652231
Author:
R. David Gustafson, Jeff Hughes
Publisher:
Cengage Learning
Glencoe Algebra 1, Student Edition, 9780079039897…
Algebra
ISBN:
9780079039897
Author:
Carter
Publisher:
McGraw Hill
College Algebra (MindTap Course List)
Algebra
ISBN:
9781305652231
Author:
R. David Gustafson, Jeff Hughes
Publisher:
Cengage Learning