3. What does the shape of the box plot imply about the concentration of data? Use complete sentences. 4. Using the box plot, how can you determine if there are potential outliers? 5. How does the standard deviation help you to determine concentration of the data and whether or not there are potential outliers? 6. What does the IQR represent in this problem? 7. Show your work to find the value that is 1.5 standard deviations: above the mean. b. below the mean. a.
3. What does the shape of the box plot imply about the concentration of data? Use complete sentences. 4. Using the box plot, how can you determine if there are potential outliers? 5. How does the standard deviation help you to determine concentration of the data and whether or not there are potential outliers? 6. What does the IQR represent in this problem? 7. Show your work to find the value that is 1.5 standard deviations: above the mean. b. below the mean. a.

Glencoe Algebra 1, Student Edition, 9780079039897, 0079039898, 2018
18th Edition
ISBN:9780079039897
Author:Carter
Publisher:Carter
Chapter10: Statistics
Section10.3: Measures Of Spread
Problem 26PFA

Related questions

Question
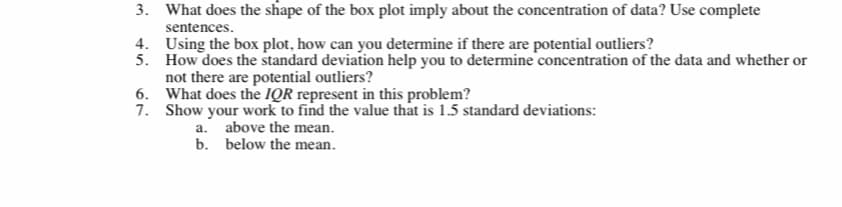
Transcribed Image Text:3. What does the shape of the box plot imply about the concentration of data? Use complete
sentences.
4. Using the box plot, how can you determine if there are potential outliers?
5. How does the standard deviation help you to determine concentration of the data and whether or
not there are potential outliers?
6. What does the IQR represent in this problem?
7. Show your work to find the value that is 1.5 standard deviations:
above the mean.
b. below the mean.
a.

Expert Solution
This question has been solved!
Explore an expertly crafted, step-by-step solution for a thorough understanding of key concepts.

This is a popular solution!

Trending now
This is a popular solution!

Step by step
Solved in 4 steps with 4 images

Knowledge Booster


Learn more about
Need a deep-dive on the concept behind this application? Look no further. Learn more about this topic, statistics and related others by exploring similar questions and additional content below.Recommended textbooks for you
Glencoe Algebra 1, Student Edition, 9780079039897…
Algebra
ISBN:
9780079039897
Author:
Carter
Publisher:
McGraw Hill
Glencoe Algebra 1, Student Edition, 9780079039897…
Algebra
ISBN:
9780079039897
Author:
Carter
Publisher:
McGraw Hill