30, 20. 80. 60. 40 55bil, 25bil, 15bil, 40bil, 35bil? The equilibrium price level is and the equilibrium level of real output is Suppose that the government spending increases by $5 billion and the expenditure multiplier in this economy is 6. On the previous graph, use the purple points (diamond symbols) to illustrate the effect of the increase in government spending on the aggregate demand (New AD) curve. The change in government spending the equilibrium level of real output by Inovease or dQcrease? 20. 5. 4. 30. 10
30, 20. 80. 60. 40 55bil, 25bil, 15bil, 40bil, 35bil? The equilibrium price level is and the equilibrium level of real output is Suppose that the government spending increases by $5 billion and the expenditure multiplier in this economy is 6. On the previous graph, use the purple points (diamond symbols) to illustrate the effect of the increase in government spending on the aggregate demand (New AD) curve. The change in government spending the equilibrium level of real output by Inovease or dQcrease? 20. 5. 4. 30. 10

Principles of Economics, 7th Edition (MindTap Course List)
7th Edition
ISBN:9781285165875
Author:N. Gregory Mankiw
Publisher:N. Gregory Mankiw
Chapter33: Aggregate Demand And Aggregate Supply
Section: Chapter Questions
Problem 5PA

Related questions
Question
Dear Expert, the question that is provided as an image is one question.
If there the questions necessitate you to interact with the graph, kindly make your work clear and apparent as to how I should accordingly interact with it.
I have provided all options you would expect to see in the form of an annotation.
Several tutors have been answering these questions wrongly so kindly consider all aspects of the question.
Thank you.
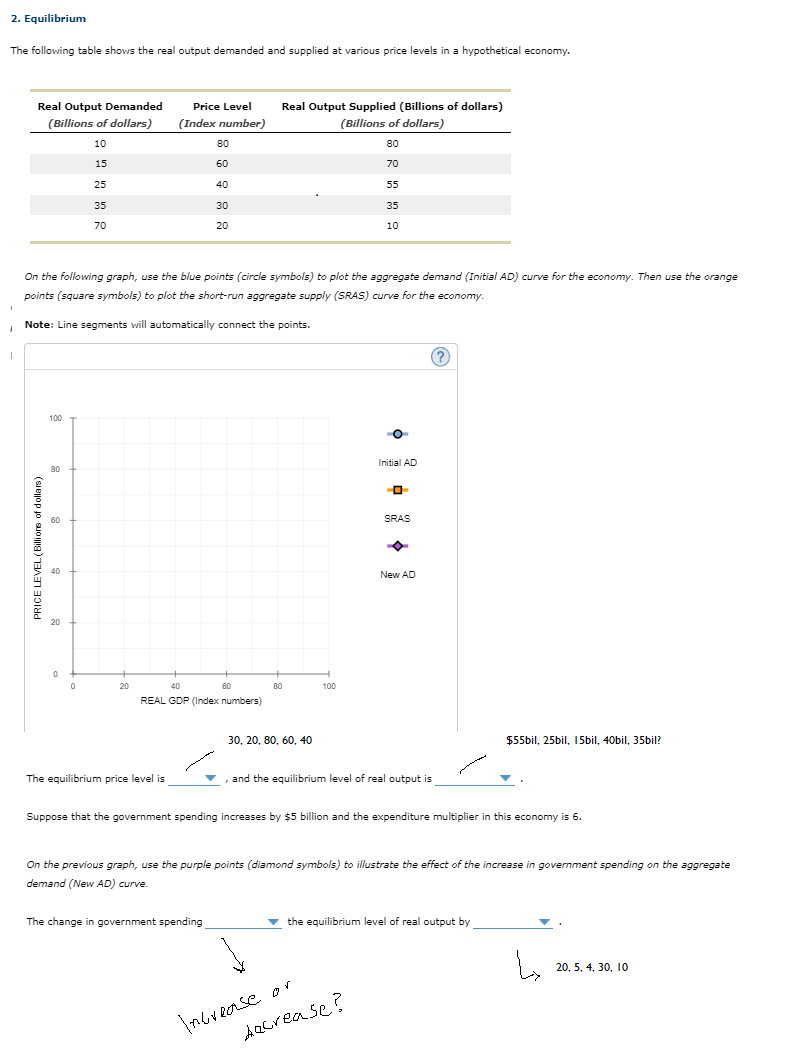
Transcribed Image Text:2. Equilibrium
The following table shows the real output demanded and supplied at various price levels in a hypothetical economy.
Real Output Demanded
Price Level
Real Output Supplied (Billions of dollars)
(Billions of dollars)
(Index number)
(Billions of dollars)
10
80
80
15
60
70
25
40
55
35
30
35
70
20
10
On the following graph, use the blue points (circle symbols) to plot the aggregate demand (Initial AD) curve for the economy. Then use the orange
points (square symbols) to plot the short-run aggregate supply (SRAS) curve for the economy.
I Note: Line segments will automatically connect the points.
100
Initial AD
80
60
SRAS
New AD
20
20
40
60
80
100
REAL GDP (Index numbers)
30. 20. 80, 60, 40
$55bil, 25bil, 15bil, 40bil, 35bil?
The equilibrium price level is
and the equilibrium level of real output is
Suppose that the government spending increases by $5 billion and the expenditure multiplier in this economy is 6.
On the previous graph, use the purple points (diamond symbols) to illustrate the effect of the increase in government spending on the aggregate
demand (New AD) curve.
The change in government spending
v
the equilibrium level of real output by
20. 5. 4. 30, 10
Inbrease
AQcrea se?
PRICE LEVEL (Billions of dollam)
Expert Solution
This question has been solved!
Explore an expertly crafted, step-by-step solution for a thorough understanding of key concepts.

This is a popular solution!

Trending now
This is a popular solution!

Step by step
Solved in 2 steps with 1 images

Knowledge Booster


Learn more about
Need a deep-dive on the concept behind this application? Look no further. Learn more about this topic, economics and related others by exploring similar questions and additional content below.Recommended textbooks for you
Principles of Economics, 7th Edition (MindTap Cou…
Economics
ISBN:
9781285165875
Author:
N. Gregory Mankiw
Publisher:
Cengage Learning

Principles of Economics (MindTap Course List)
Economics
ISBN:
9781305585126
Author:
N. Gregory Mankiw
Publisher:
Cengage Learning

Principles of Macroeconomics (MindTap Course List)
Economics
ISBN:
9781305971509
Author:
N. Gregory Mankiw
Publisher:
Cengage Learning
Principles of Economics, 7th Edition (MindTap Cou…
Economics
ISBN:
9781285165875
Author:
N. Gregory Mankiw
Publisher:
Cengage Learning
Principles of Economics (MindTap Course List)
Economics
ISBN:
9781305585126
Author:
N. Gregory Mankiw
Publisher:
Cengage Learning
Principles of Macroeconomics (MindTap Course List)
Economics
ISBN:
9781305971509
Author:
N. Gregory Mankiw
Publisher:
Cengage Learning

Brief Principles of Macroeconomics (MindTap Cours…
Economics
ISBN:
9781337091985
Author:
N. Gregory Mankiw
Publisher:
Cengage Learning

Essentials of Economics (MindTap Course List)
Economics
ISBN:
9781337091992
Author:
N. Gregory Mankiw
Publisher:
Cengage Learning

Principles of Macroeconomics (MindTap Course List)
Economics
ISBN:
9781285165912
Author:
N. Gregory Mankiw
Publisher:
Cengage Learning