Use the graph to illustrate the effects of a $10 billion increase in government spending. Assume that the economy is initially producing at full employment, and the spending multiplier (m³) is 10. 165 LRAS 160 155 150 145 140 135 130 125 AD 120 115 50 100 150 200 250 300 350 400 450 500 Real GDP How much of each additional dollar of income is devoted to consumption? MPC = $ Price level (P)
Use the graph to illustrate the effects of a $10 billion increase in government spending. Assume that the economy is initially producing at full employment, and the spending multiplier (m³) is 10. 165 LRAS 160 155 150 145 140 135 130 125 AD 120 115 50 100 150 200 250 300 350 400 450 500 Real GDP How much of each additional dollar of income is devoted to consumption? MPC = $ Price level (P)

Chapter24: Fiscal Policy
Section: Chapter Questions
Problem 8P

Related questions
Question
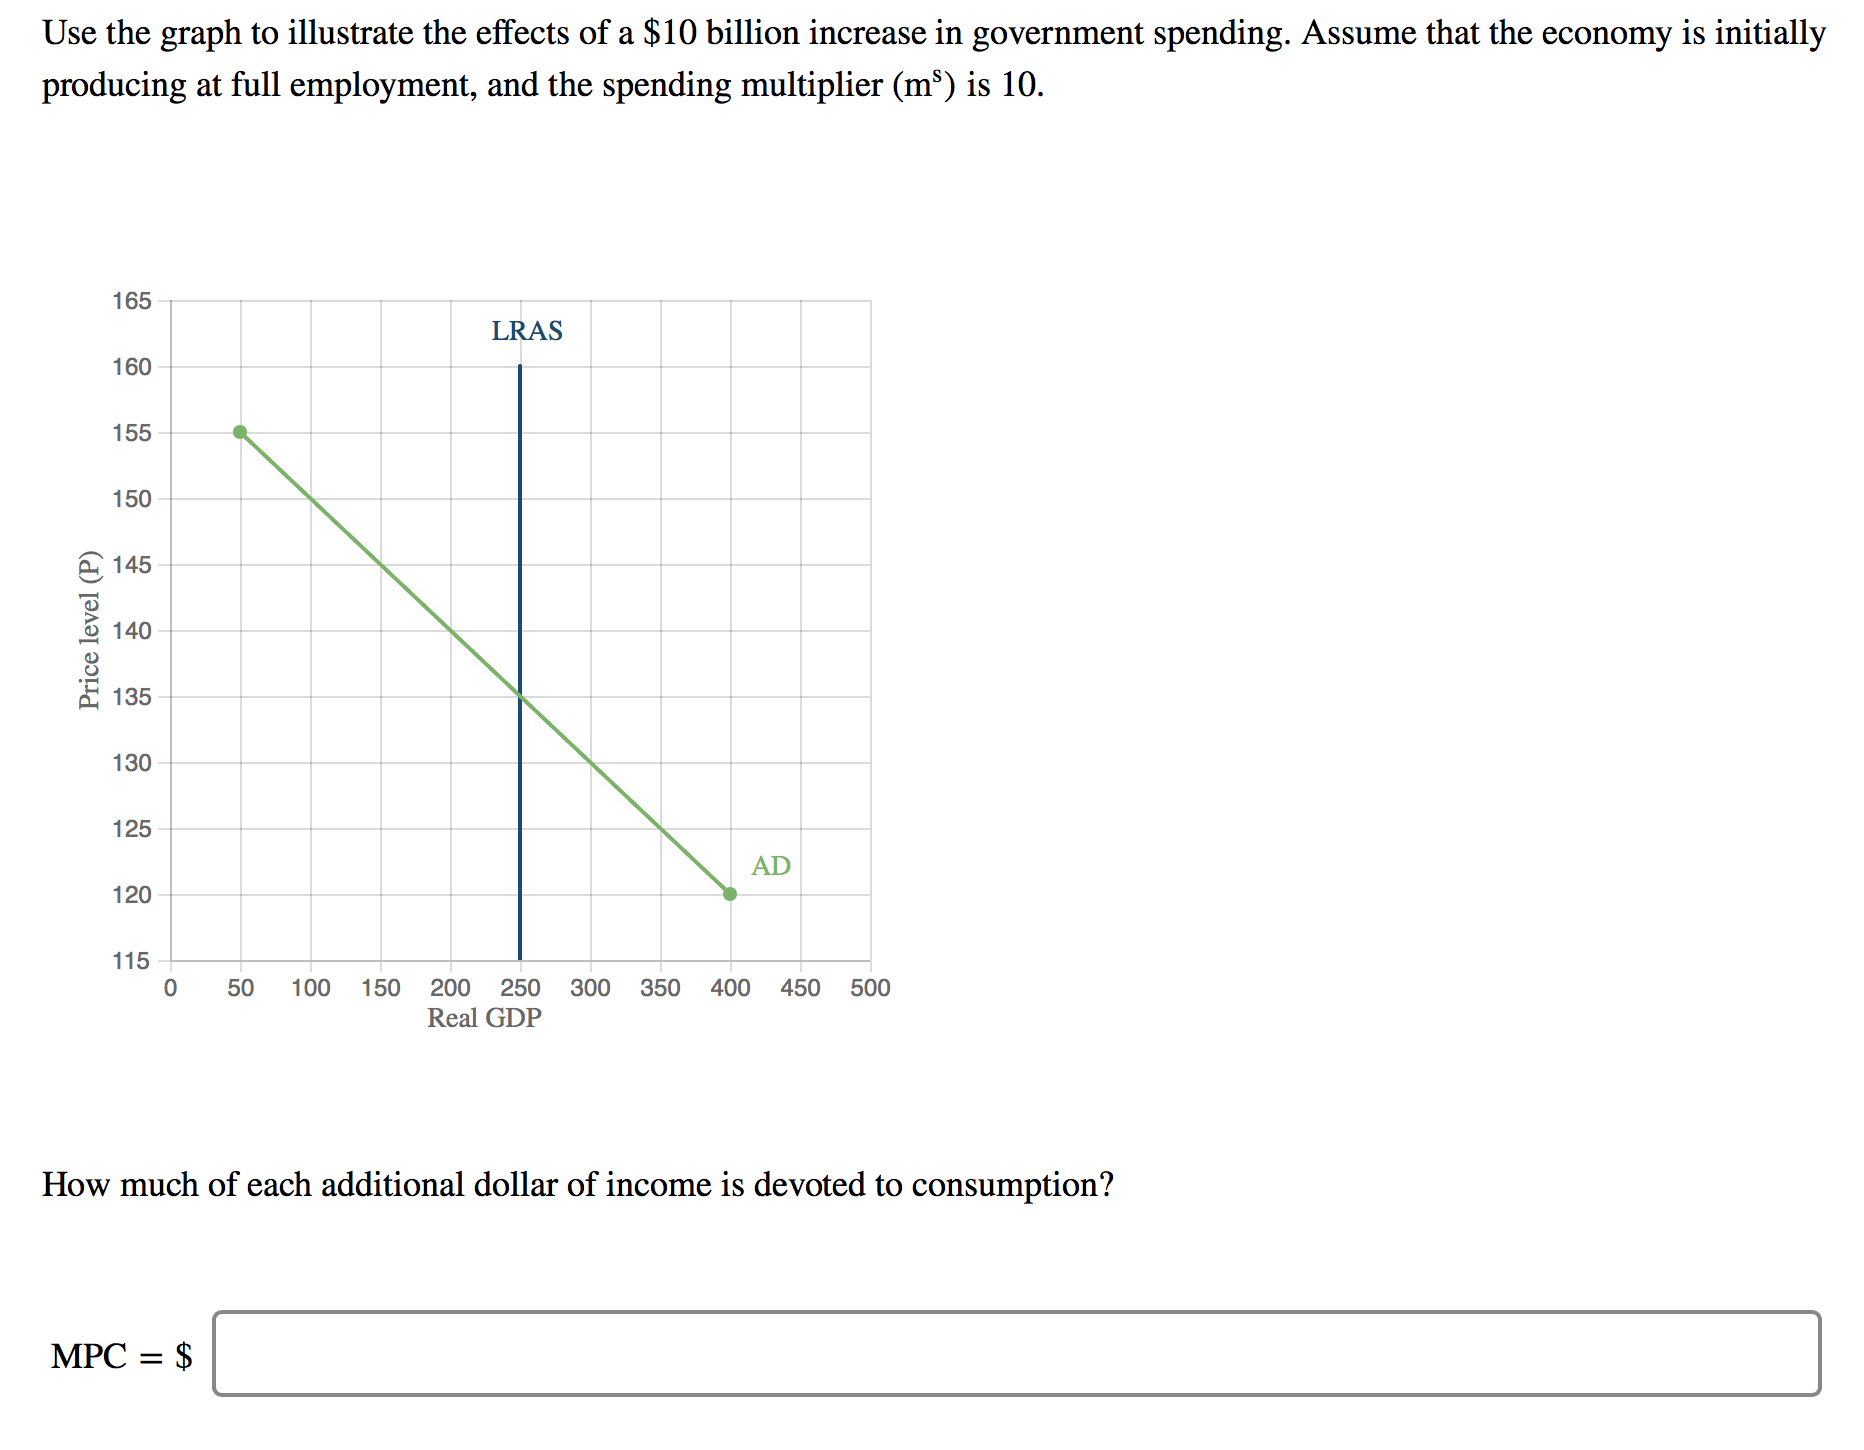
Transcribed Image Text:Use the graph to illustrate the effects of a $10 billion increase in government spending. Assume that the economy is initially
producing at full employment, and the spending multiplier (m³) is 10.
165
LRAS
160
155
150
145
140
135
130
125
AD
120
115
50
100
150
200
250
300
350
400
450
500
Real GDP
How much of each additional dollar of income is devoted to consumption?
MPC = $
Price level (P)
Expert Solution
This question has been solved!
Explore an expertly crafted, step-by-step solution for a thorough understanding of key concepts.

This is a popular solution!

Trending now
This is a popular solution!

Step by step
Solved in 2 steps with 1 images

Knowledge Booster


Learn more about
Need a deep-dive on the concept behind this application? Look no further. Learn more about this topic, economics and related others by exploring similar questions and additional content below.Recommended textbooks for you
Exploring Economics
Economics
ISBN:
9781544336329
Author:
Robert L. Sexton
Publisher:
SAGE Publications, Inc


Brief Principles of Macroeconomics (MindTap Cours…
Economics
ISBN:
9781337091985
Author:
N. Gregory Mankiw
Publisher:
Cengage Learning
Exploring Economics
Economics
ISBN:
9781544336329
Author:
Robert L. Sexton
Publisher:
SAGE Publications, Inc
Brief Principles of Macroeconomics (MindTap Cours…
Economics
ISBN:
9781337091985
Author:
N. Gregory Mankiw
Publisher:
Cengage Learning

Essentials of Economics (MindTap Course List)
Economics
ISBN:
9781337091992
Author:
N. Gregory Mankiw
Publisher:
Cengage Learning

