34. Which of the following is the most appropriate test to determin there exist an association between BMI status (underweight, norm overweight, obese) and whether or not a person smoke. OA. Chi-Square test of independence O B. Chi-Square Goodness of fit test O C. Fisher's exact test D. t-test on Correla on
34. Which of the following is the most appropriate test to determin there exist an association between BMI status (underweight, norm overweight, obese) and whether or not a person smoke. OA. Chi-Square test of independence O B. Chi-Square Goodness of fit test O C. Fisher's exact test D. t-test on Correla on

Holt Mcdougal Larson Pre-algebra: Student Edition 2012
1st Edition
ISBN:9780547587776
Author:HOLT MCDOUGAL
Publisher:HOLT MCDOUGAL
Chapter11: Data Analysis And Probability
Section11.5: Interpreting Data
Problem 1C

Related questions
Question
34
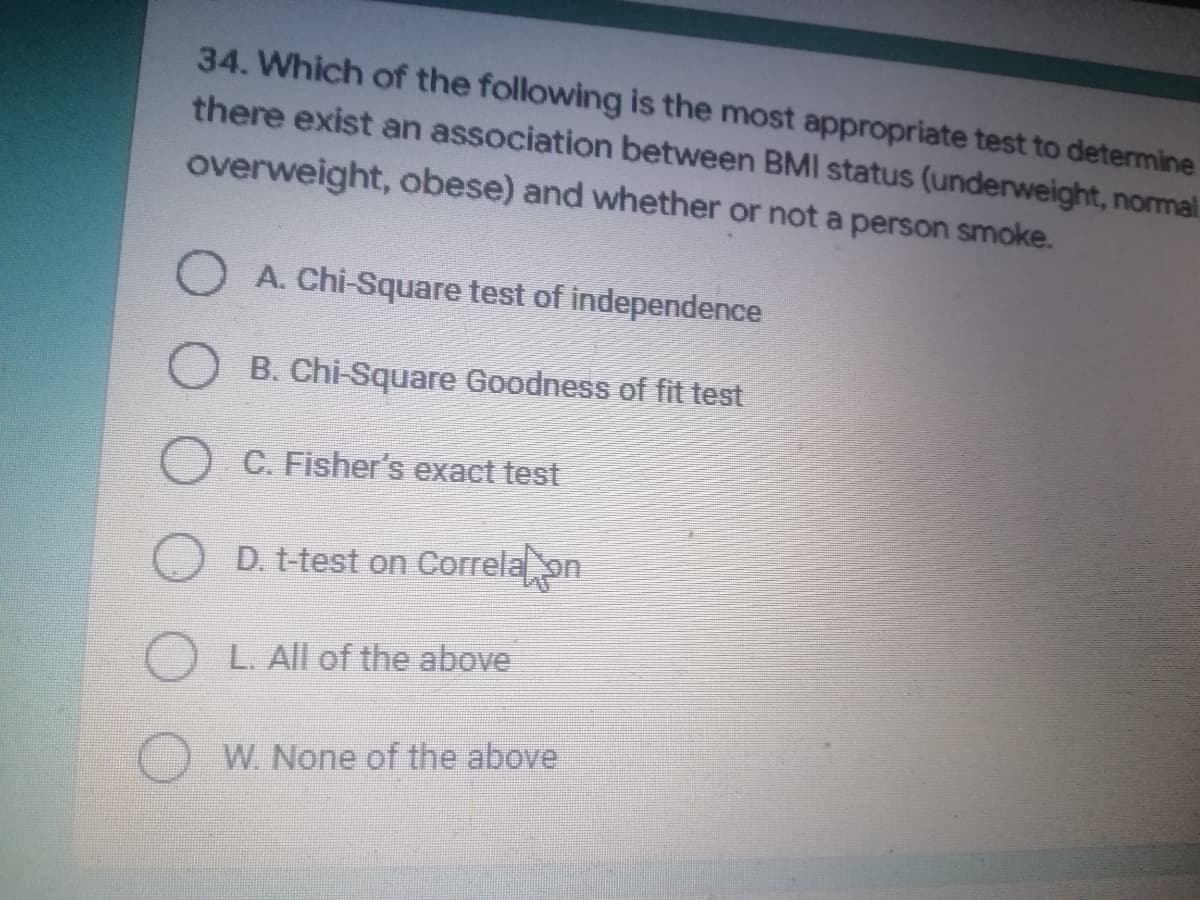
Transcribed Image Text:34. Which of the following is the most appropriate test to determine
there exist an association between BMI status (underweight, normal
overweight, obese) and whether or not a person smoke.
A. Chi-Square test of independence
B. Chi-Square Goodness of fit test
Fisher's exact test
D. t-test on Correla on
L. All of the above
W. None of the above
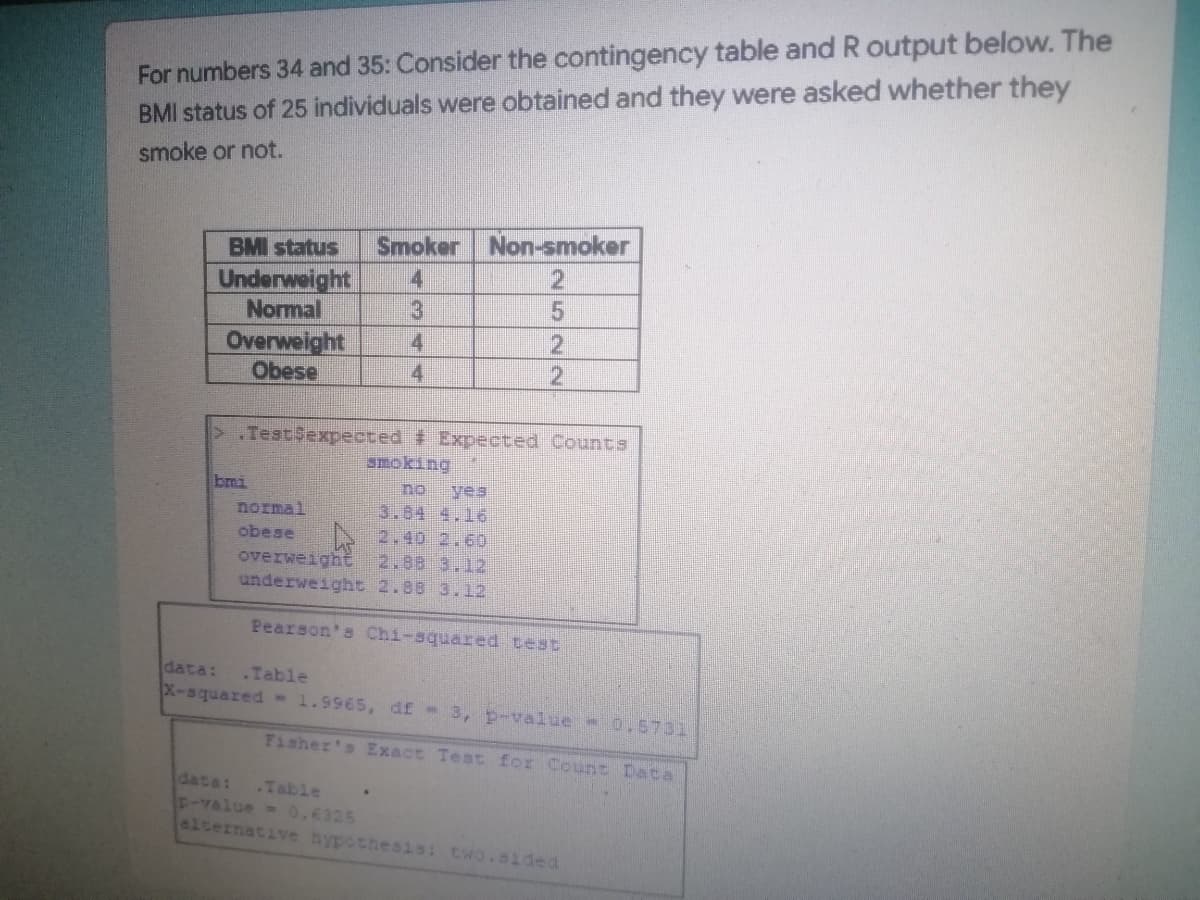
Transcribed Image Text:For numbers 34 and 35: Consider the contingency table and R output below. The
BMI status of 25 individuals were obtained and they were asked whether they
smoke or not.
BMI status Smoker Non-smoker
Underweight
4
2
Normal
3
5
Overweight
4
2
Obese
4
2
TestSexpected # Expected Counts
Smoking
bmi
no
yes
normal
obese
2.40 2.60
overweight 2.88 3.12
underweight 2.88 3.12
Pearson's Chi-squared test
data: .Table
X-squared-1.9965, df = 3, p-value * 015731
Fisher's Exact Test for Count Data
.Table
P-value = 0.6325
alternative hypothesis: two.sided
Expert Solution
This question has been solved!
Explore an expertly crafted, step-by-step solution for a thorough understanding of key concepts.

Step by step
Solved in 2 steps

Recommended textbooks for you
Holt Mcdougal Larson Pre-algebra: Student Edition…
Algebra
ISBN:
9780547587776
Author:
HOLT MCDOUGAL
Publisher:
HOLT MCDOUGAL
Holt Mcdougal Larson Pre-algebra: Student Edition…
Algebra
ISBN:
9780547587776
Author:
HOLT MCDOUGAL
Publisher:
HOLT MCDOUGAL