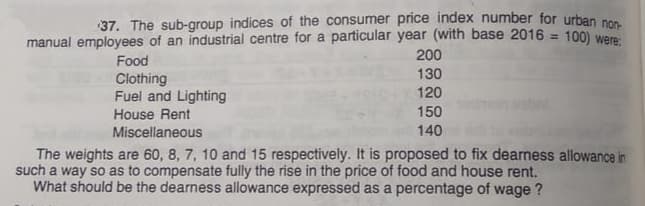
37. The sub-group indices of the consumer price index number for urban non manual employees of an industrial centre for a particular year (with base 2016 = 100) were 200 Food 130 Clothing Fuel and Lighting 120 House Rent 150 Miscellaneous 140 The weights are 60, 8, 7, 10 and 15 respectively. It is proposed to fix dearness allowance in such a way so as to compensate fully the rise in the price of food and house rent. What should be the dearness allowance expressed as a percentage of wage ?
Q: The quantities and prices if products A and B used by a company in the years 2019-2020 are given…
A: Laspeyre's price index method the price of the commodities in the base year as well as the current…
Q: a. Compute the relative risk of coronary artery disease in patients receiving the new cholesterol…
A: Amongst the provided tables, table 3-11 is used to answer the asked questions.a) The relative risk…
Q: 5. In 2010 consumption (Ci) for selected countries was as follows Jordan 2.5 billion $, USA 100…
A: The regression equation is given as: Ci = B1+B2Yi+Ui Here Ci is the average value of consumption…
Q: 2. Suppose a liner housing price function rice = -105,000 + 60 aea + 32,000 raing +109,000 · zoingrH…
A: Given that - Suppose a liner housing price functionprice = -105,000 + 60 area + 32,000 rating +…
Q: 3. 5. A clinical trial is being conducted in order to determine the efficacy of a new drug that will…
A: The level of significance is 0.05.
Q: (7) During the spring, the demand for electric fans at a large home-improvement store is quite…
A: Given: Mean = 200Standard deviation = 50Significance level = 5% The reorder point has to be…
Q: a. The average prices and quantities of six hypothetical items offered by a government agency…
A: Index numbers are statistical devices that are used to measure the relative changes and differences…
Q: 3. According to a Los Angeles Times study of more than 1 million medical dispatches from 2007 to…
A: The mean is the average value of the data and mode is the value that has highest frequency in the…
Q: In a 1996 article published in Technometrics, 38, pp. 11–22, the authors discuss the reliability of…
A: Null Hypothesis: H0: There is no significant difference between the groups. Alternative Hypothesis:…
Q: In a 1996 article published in Technometrics, 38, pp. 11–22, the authors discuss the reliability of…
A: Conditions for conducting ANOVA:The sample must be drawn from a normally distributed population.All…
Q: 8.12 Crawling babies, Part I. A study conducted at the University of Denver investigated whether…
A: Given that, The temperature is measured in degrees FahrenheitF0 and age is measured in weeks.…
Q: 14. A Private bank want to know whether their mortgage rate is in line with the data history of…
A: Introduction: As the manager wishes to use a simple linear analysis to determine whether the…
Q: 2 The scatterplot shows the average annual female income plotted against average annual 40 male…
A: 2. The scatter plot shows average of annual female income against average annual male income is 15…
Q: 4 According to sales information in the first quarter of 2016, 2.5% of new vehicles sold in the…
A: Given dataNo of vehicles (n) = 35Probability that the new car sales is hybrid (p) = 0.025a)Expected…
Q: 2)- Industrial engineers periodically conduct "work measurement' analysis to determine the time…
A: The total working hours of worker in 50 days is,128, 119, 95, 97, 124, 128, 142, 98, 108, 120, 113,…
Q: A purchasing agent obtained samples of 60 watt bulbs from two companies. He / She had the sample…
A: Coefficient of variation is used to find the dispersion of the observation from the mean. If the…
Q: In a 1996 article published in Technometrics, 38, pp. 11–22, the authors discuss the reliability of…
A: Introduction:The null and alternative hypotheses for both the tests are:H0: There is no significant…
Q: Did I answer the question #3 of my homework correctly?
A: Given a data of endotoxin levels in children as a function of their proximity to operatinf farms as…
Q: In order to forecast enrollment for next fall, XYZ University of the CBA wishes to forecast…
A: By regression we mean estimation or prediction of the average value of one variable for specified…
Q: Deluxe River Cruises operates a fleet of river vessels. The fleet has two types of vessels: A type A…
A:
Q: This exercise requires the use of technology. Four sectors of the U.S. economy are (1) livestock…
A: Given the input-output table involving four sectors of U.S economy in the year of 1977. To determine…
Q: 1. Suppose that the observational units in a study are patients who have come into Petaluma Family…
A: Qualitative variable: A variable that is qualitative in nature is called a Qualitative variable…
Q: The busiest time of the day at the Taco Town fast-food restaurant is between 11:00 A.M. and 2:00…
A: Given: The busiest time based on the Taco Town fast-food restaurant is between 11:00 A.M. and 2:00…
Q: Acme Motorcycle Co has determined that the engine size (in cc) is the key cost driver for estimating…
A: Hi! Thank you for the question, As per the honor code, we are allowed to answer three sub-parts at a…
Q: Journal of Economic, Political and Business Analysis XIV (2) delivers a report on the stagnation of…
A: Average=sum of observationsnumber of observationsMedian=n+12th observation if n is oddn2+n2+1th…
Q: A bank developed a model for predicting the average checking and savings account balance as balance…
A:
Q: 5.3.2. The production of a nationally marketed deter- gent results in certain workers receiving…
A: Given Information : The production of a nationally marketed detergent results in certain workers…
Q: 4. In water-resources engineering, the sizing of reservoirs depends on accurate estimates of water…
A: Data ploting
Q: 3. Your aerobics instructor informs you that to receive full physical benefit from eve ing, your…
A: to answer questions using given table
Q: a. The average prices and quantities of six hypothetical items offered by a government agency…
A: Since the question is of multiple parts , we shall solve the part b only, if you want us to solve…
Q: This exercise requires the use of technology. Four sectors of the U.S. economy are (1) livestock and…
A: Given, Four sectors of the U.S. economy are (1) livestock and livestock products, (2) other…
Q: Let's examine labor force participation in October 2019, July 2020, and October 2020 Household…
A: Labor Force Participation rate: It is the percentage of the population that is either working or…
Q: In order to forecast enrollment for next fall, XYZ University of the CBA wishes to forecast…
A: The enrollment data of past 10 years os given. We need to calculate the slope, intercept, and linear…
Q: The sales manager of a large automotive parts distributor wants to estimate the total annual sales…
A: Given data, Region Annual sales ($ million) Number of retail outlets Number of automobiles…
Q: 10. When appropriate, refer to the StatCrunch analysis you believe is correct in this problem. Ramp…
A: One of the small sample tests is the t-test. It is used to find the significant difference between…
Q: onomic growth of Pakistan. He wanted to analyze data of Pakistan since its independence till date…
A: It is an important part of statistics. It is widely used.
Q: Five samples of food were analysed to determine their Vitamin A, Vitamin C and other Vitamins…
A: Disclaimer: As the question contains multiple parts, only first three will be answered. We know that…
Q: C. Classify the following variables as quantitative or qualitative variables. If the variable is…
A: The quantitative variables are those variables which take countable number or discrete. The…
Q: Suppose you have been hired as a management consultant by a major oil company to help it optimally…
A: In this case, it is needed to perform a study on customers' gasoline purchasing habits when they…
Q: The retention of nitrogen in the soil is an important consideration in cultivation practices,…
A: The random variable percentage of recovered nitrogen follows normal distribution. There are two…
Q: 9. The chief executive of Rex Cars wants to investigate the relationship between the number of new…
A: The independent variable is Cost of advertising. The dependent variable is Number of new car sales.…
Q: 2.4. CJ The numbers of homicides in five U.S. states and five Canadian provinces for the years 1997…
A: The overall death rate per 1,00,000 population is given by,
Q: 3. A social worker is interested in examining how people who have higher levels of psychological…
A:
Q: Refer to the comparison line graph which shows how the net worth of Claire Kozar's retirement…
A: Consider the graph provided in question. The graph represents the retirement savings at different…
Q: 3. The table below gives details of price and consumption of 5 commodities for 1995 and 1997. Using…
A:
Q: B - Does there appear to be a relationship between income and sadness, hopelessness, and…
A: From the above plot, we can see that when the income is low then the sadness, hopelessness and…
Q: In 1993 the average expenditure of the employees on food anu was as follows : tenis In Cuttack In…
A:
Q: 3. Scenario It is believed that large doses of acetaminophen (the active ingredient in over the…
A: It is given that half of the liver is nearly tested. Therefore, Sample proportionp^=0.50 pay each…
Q: A shoe wholesaler wants to optimize its shipment of shoes to its client retailers. To minimize their…
A: Problem statement: wholesaler wants to know if weather conditions are important in determining the…
Step by step
Solved in 2 steps with 2 images
- 2) . In February 2021, the Chicago Tribune reported:“The overdose epidemic that has ravaged Chicago has not spared the nearby suburbs, some of which have death rates comparable to anything seen in the city, according to a report released this week by the Cook County Department of Public Health. ZIP codes in the towns of Worth, Broadview, Maywood, and Forest Park, areas that “have substantially lower median household incomes and higher poverty rates,” have been especially hard-hit, the report said.”In the article, they claimed that lower incomes were associated with higher overdose death rates and that overdose death rates are increasing over time. The data you have been analyzing wasn’t focused on Chicago, obviously. But do your results support the general gist of the statistical argument being made in this Tribune excerpt? Please address:• Do overdose death rates appear to be associated with per capita income (use scatterplot)?• Do overdose death rates appear to be increasing over…3.6 With the increase in the mobility of the population in the United States and with the increasein home-based employment, there is an inclination to assume that the personal income in theUnited States will become fairly uniform across the country. The following table provides the percapita personal income for each of the 50 states and the District of Columbia.Income(thousands of dollars) Number of States22.0–24.9 525.0–27 .9 1328.0–30.9 1631.0–33.9 934.0–36.9 437 .0–39.9 240.0–42.9 2 Total 51 a. Construct a relative frequency histogram for the income data.b. Describe the shape of the histogram using the standard terminology ofhistograms.c. Would you describe per capita income as being fairly homogenous across…In a 1996 article published in Technometrics, 38, pp. 11–22, the authors discuss the reliability of nuclear power plant emergency generators. To control the risk of damage to the nuclear core during accidents at nuclear plants, the reliability of emergency diesel generators (EDG) to start on demand must be maintained at a very high level. At each nuclear power plant there are a number of such generators. An overall measure of reliability is obtained by counting the number of times the EDGs successfully work when needed. The table here provides the number of successful demands for implementation of an EDG between each subsequent failure in an EDG for all the EDGs at each of seven nuclear power plants. A regulatory agency wants to determine if there is a difference in the reliability of the seven nuclear power plants. (Use Data _8). Run an ANOVA (Regardless of the assumptions) and Kruskal–Wallis test.
- In a 1996 article published in Technometrics, 38, pp. 11–22, the authors discuss the reliability of nuclear power plant emergency generators. To control the risk of damage to the nuclear core during accidents at nuclear plants, the reliability of emergency diesel generators (EDG) to start on demand must be maintained at a very high level. At each nuclear power plant there are a number of such generators. An overall measure of reliability is obtained by counting the number of times the EDGs successfully work when needed. The table here provides the number of successful demands for implementation of an EDG between each subsequent failure in an EDG for all the EDGs at each of seven nuclear power plants. A regulatory agency wants to determine if there is a difference in the reliability of the seven nuclear power plants. (Use Data _8). Do the conditions necessary for conducting the ANOVA test appear to be satisfied by these data? Run an ANOVA (Regardless of the assumptions) and…In a 1996 article published in Technometrics, 38, pp. 11–22, the authors discuss the reliability of nuclear power plant emergency generators. To control the risk of damage to the nuclear core during accidents at nuclear plants, the reliability of emergency diesel generators (EDG) to start on demand must be maintained at a very high level. At each nuclear power plant there are a number of such generators. An overall measure of reliability is obtained by counting the number of times the EDGs successfully work when needed. The table here provides the number of successful demands for implementation of an EDG between each subsequent failure in an EDG for all the EDGs at each of seven nuclear power plants. A regulatory agency wants to determine if there is a difference in the reliability of the seven nuclear power plants. (Use Data _8). Do the conditions necessary for conducting the ANOVA test appear to be satisfied by these data?7.6 A leading researcher in the study of interstate highway accidents proposes that a major cause of many collisions on the interstates is not the speed of the vehicles but rather the difference in speeds of the vehicles. When some vehicles are traveling slowly while other vehicles are traveling at speeds greatly in excess of the speed limit, the faster-moving vehicles may have to change lanes quickly, which can increase the chance of an accident. Thus, when there is a large variation in the speeds of the vehicles in a given location on the interstate, there may be a larger number of accidents than when the traffic is moving at a more uniform speed. The researcher believes that when the standard deviation in speed of vehicles exceeds 10 mph, the rate of accidents is greatly increased. During a 1-hour period of time, a random sample of 50 vehicles is selected from a section of an interstate known to have a high rate of accidents, and their speeds are recorded using a radar gun. The data…
- (6.15)- Refer to the data in Table 2.13. Regard this hospital as typical of Pennsylvania hospitals. A-What is the best point estimate of the percentage of males among patients discharged from Pennsylvania hospitals?B-What is the standard error of the estimate obtained in Problem A?C-Provide a 95% CI for the percentage of males among patients discharged from Pennsylvania hospitalsa) A C-chart is to be constructed for the count of surface defects in 2000 square meters of 40-kg Kraft paper. If 55 lots had a total of 550 defects. Determine the trial central line and control limits.b) An (np) chart is to be established on a painting process that is in statistical control. If 60 pieces are to be inspected every 3 hours and the fraction non-conforming is 0.06, determine the central line and control limitsDave Fletcher, the general manager of North Carolina Engineering Corporation (NCEC), thinks that his firm’s engineer-ing services contracted to highway construction firms are directly related to the volume of highway construction business contractedwith companies in his geographic area. He wonders if this is reallyso, and if it is, can this information help him plan his operationsbetter by forecasting the quantity of his engineering servicesrequired by construction firms in each quarter of the year? Thefollowing table presents the sales of his services and total amountsof contracts for highway construction over the past eight quarters: a) Using this data, develop a regression equation for predictingthe level of demand of NCEC’s services. b) Determine the coefficient of correlation and the standard errorof the estimate.
- 3. Scenario It is believed that large doses of acetaminophen (the active ingredient in over the counter pain relievers like Tylenol) may cause damage to the liver in nearly half of those tested. A researcher wants to conduct a study to estimate if the proportion of acetaminophen users who have liver damage is the same as previously reported. For participating in this study, he will pay each subject $20 and provide a free medical consultation if the patient has liver damage. Part A If he wants to limit the margin of error of his 98% confidence interval to 2%, what is the minimum number of subjects he needs? (answer should be in the form of x,xxx) the minimum amount of money he needs to set aside to pay his subjects? $ (answer should be in the form of $xx,xxx) Part B The amount you calculated in Part A is substantially over his budget so he decides to use fewer subjects. Will this change increase or decrease the width of his confidence interval? Will this new confidence interval be…(3.2 #16c) Most Expensive Colleges Listed below are the annual costs (dollars) of tuition and fees at the ten most expensive colleges in the United States for a recent year (based on data from U.S. News & World Report). The colleges listed in order are Columbia, Vassar, Harvey Mudd, University of Chicago, Trinity, Franklin and Marshall, Tufts, Amherst, University of Southern California, and Sarah Lawrence. 57,208 55,210 54,886 54,825 54,770 54,380 54,318 54,310 54,259 54,010 What is the standard deviation of this sample?8A.If there is no seasonal effect on people getting sick, we would expect equal numbers of people getting sick in each season (winter, spring, summer and fall). A student takes a census of students who took Marketing Research in 2019 and finds that of the 280 students who took Marketing Research in 2019, 75 were sick in winter, 65 were sick in spring, 68 were sick in summer and 72 were sick in fall. She wonders if the excess in the winter is an indication that sickness rates are not uniform throughout the year. Perform the appropriate chi-square test and indicate the chi-square value below. (Report two decimals) QUESTION 8b Indicate whether the associated p-value for the chi-square value you calculated for question 8 is significant. Yes No