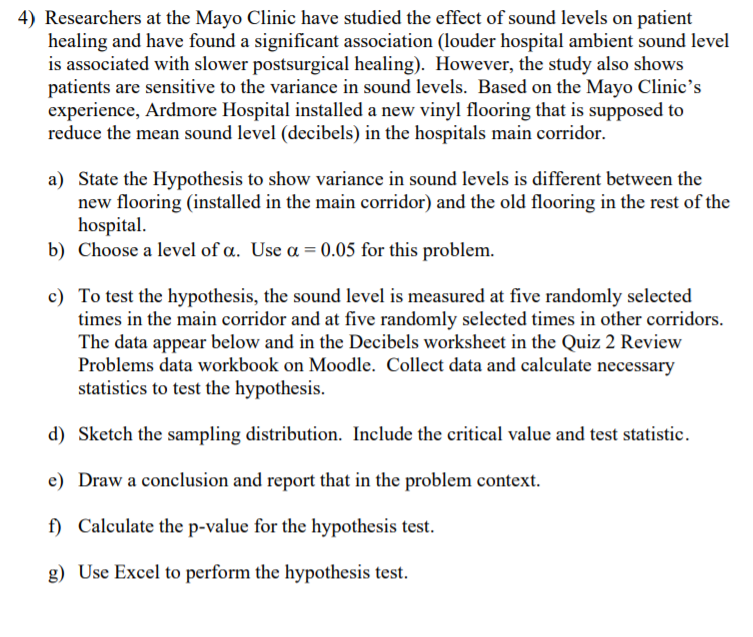
4) Researchers at the Mayo Clinic have studied the effect of sound levels on patient healing and have found a significant association (louder hospital ambient sound level is associated with slower postsurgical healing). However, the study also shows patients are sensitive to the variance in sound levels. Based on the Mayo Clinic's experience, Ardmore Hospital installed a new vinyl flooring that is supposed to reduce the mean sound level (decibels) in the hospitals main corridor. a) State the Hypothesis to show variance in sound levels is different between the new flooring (installed in the main corridor) and the old flooring in the rest of the hospital. b) Choose a level of a. Use a = 0.05 for this problem. c) To test the hypothesis, the sound level is measured at five randomly selected times in the main corridor and at five randomly selected times in other corridors. The data appear below and in the Decibels worksheet in the Quiz 2 Review Problems data workbook on Moodle. Collect data and calculate necessary statistics to test the hypothesis. d) Sketch the sampling distribution. Include the critical value and test statistic. e) Draw a conclusion and report that in the problem context. Calculate the p-value for the hypothesis test. f) g) Use Excel to perform the hypothesis test. Old Flooring 48 New Flooring 42 51 41 44 40 48 37 52 44
4) Researchers at the Mayo Clinic have studied the effect of sound levels on patient healing and have found a significant association (louder hospital ambient sound level is associated with slower postsurgical healing). However, the study also shows patients are sensitive to the variance in sound levels. Based on the Mayo Clinic's experience, Ardmore Hospital installed a new vinyl flooring that is supposed to reduce the mean sound level (decibels) in the hospitals main corridor. a) State the Hypothesis to show variance in sound levels is different between the new flooring (installed in the main corridor) and the old flooring in the rest of the hospital. b) Choose a level of a. Use a = 0.05 for this problem. c) To test the hypothesis, the sound level is measured at five randomly selected times in the main corridor and at five randomly selected times in other corridors. The data appear below and in the Decibels worksheet in the Quiz 2 Review Problems data workbook on Moodle. Collect data and calculate necessary statistics to test the hypothesis. d) Sketch the sampling distribution. Include the critical value and test statistic. e) Draw a conclusion and report that in the problem context. Calculate the p-value for the hypothesis test. f) g) Use Excel to perform the hypothesis test. Old Flooring 48 New Flooring 42 51 41 44 40 48 37 52 44

Glencoe Algebra 1, Student Edition, 9780079039897, 0079039898, 2018
18th Edition
ISBN:9780079039897
Author:Carter
Publisher:Carter
Chapter10: Statistics
Section10.3: Measures Of Spread
Problem 1GP

Related questions
Question
Transcribed Image Text:4) Researchers at the Mayo Clinic have studied the effect of sound levels on patient
healing and have found a significant association (louder hospital ambient sound level
is associated with slower postsurgical healing). However, the study also shows
patients are sensitive to the variance in sound levels. Based on the Mayo Clinic's
experience, Ardmore Hospital installed a new vinyl flooring that is supposed to
reduce the mean sound level (decibels) in the hospitals main corridor.
a) State the Hypothesis to show variance in sound levels is different between the
new flooring (installed in the main corridor) and the old flooring in the rest of the
hospital.
b) Choose a level of a. Use a = 0.05 for this problem.
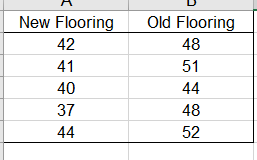
c) To test the hypothesis, the sound level is measured at five randomly selected
times in the main corridor and at five randomly selected times in other corridors.
The data appear below and in the Decibels worksheet in the Quiz 2 Review
Problems data workbook on Moodle. Collect data and calculate necessary
statistics to test the hypothesis.
d) Sketch the sampling distribution. Include the critical value and test statistic.
e) Draw a conclusion and report that in the problem context.
Calculate the p-value for the hypothesis test.
f)
g) Use Excel to perform the hypothesis test.
Transcribed Image Text:Old Flooring
48
New Flooring
42
51
41
44
40
48
37
52
44
Expert Solution
This question has been solved!
Explore an expertly crafted, step-by-step solution for a thorough understanding of key concepts.

This is a popular solution!

Trending now
This is a popular solution!

Step by step
Solved in 3 steps with 3 images

Recommended textbooks for you
Glencoe Algebra 1, Student Edition, 9780079039897…
Algebra
ISBN:
9780079039897
Author:
Carter
Publisher:
McGraw Hill
Glencoe Algebra 1, Student Edition, 9780079039897…
Algebra
ISBN:
9780079039897
Author:
Carter
Publisher:
McGraw Hill