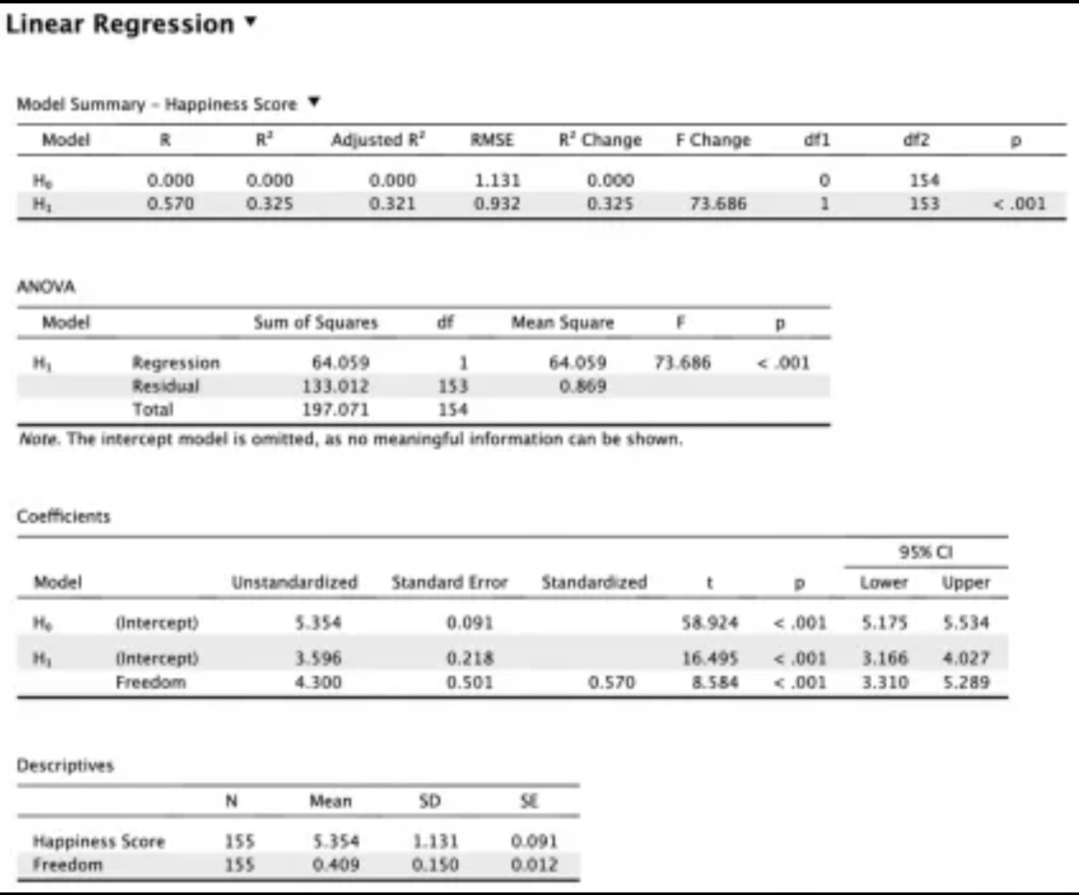
4. In 2017, a global scale research was conducted to determine the effects of certain factors to world happiness across 155 countries. In the first study, the research was interested how the country's level of freedom influences their level of happiness. Using the results found below, provide a Table-Reading Text given the results found below.
4. In 2017, a global scale research was conducted to determine the effects of certain factors to world happiness across 155 countries. In the first study, the research was interested how the country's level of freedom influences their level of happiness. Using the results found below, provide a Table-Reading Text given the results found below.

Elementary Linear Algebra (MindTap Course List)
8th Edition
ISBN:9781305658004
Author:Ron Larson
Publisher:Ron Larson
Chapter2: Matrices
Section2.6: More Applications Of Matrix Operations
Problem 18E

Related questions
Question
Transcribed Image Text:4. In 2017, a global scale research was conducted to determine the effects of certain
factors to world happiness across 155 countries. In the first study, the research was
interested how the country's level of freedom influences their level of happiness. Using
the results found below, provide a Table-Reading Text given the results found below.
Transcribed Image Text:Linear Regression
Model Summary - Happiness Score
Model
R
R²
He
H₂
ANOVA
Model
Coefficients
Model
He
H₂
0.000
0.570
Descriptives
Regression
Residual
Total
Intercept)
Intercept)
Freedom
Happiness Score
Freedom
0.000
0.325
N
Adjusted R²
Sum of Squares
64.059
133.012
197.071
Note. The intercept model is omitted, as no meaningful information can be shown,
Unstandardized
155
155
5.354
3.596
4.300
Mean
0.000
0.321
5.354
0.409
df
RMSE
1
153
154
SD
1.131
0.932
1.131
0.150
R² Change
0.000
0.325
Standard Error Standardized
0.091
0.218
0.501
Mean Square
64.059
0.869
0.091
0.012
F Change
0.570
73.686
F
73.686
t
58.924
16.495
8.584
p
difl
<.001
0
1
P
df2
Lower
<.001 5.175
<.001 3.166
<.001 3.310
154
153
95% CI
P
<.001
Upper
5.534
4.027
5.289
Expert Solution
This question has been solved!
Explore an expertly crafted, step-by-step solution for a thorough understanding of key concepts.

Step by step
Solved in 3 steps with 3 images

Recommended textbooks for you
Elementary Linear Algebra (MindTap Course List)
Algebra
ISBN:
9781305658004
Author:
Ron Larson
Publisher:
Cengage Learning


Algebra & Trigonometry with Analytic Geometry
Algebra
ISBN:
9781133382119
Author:
Swokowski
Publisher:
Cengage
Elementary Linear Algebra (MindTap Course List)
Algebra
ISBN:
9781305658004
Author:
Ron Larson
Publisher:
Cengage Learning
Algebra & Trigonometry with Analytic Geometry
Algebra
ISBN:
9781133382119
Author:
Swokowski
Publisher:
Cengage