c. Identify the factors affecting the endogenous variables. Leave blank if variable is exogenous. W: __________ X: __________ Y: __________ Z: __________ A: __________
c. Identify the factors affecting the endogenous variables. Leave blank if variable is exogenous. W: __________ X: __________ Y: __________ Z: __________ A: __________

MATLAB: An Introduction with Applications
6th Edition
ISBN:9781119256830
Author:Amos Gilat
Publisher:Amos Gilat
Chapter1: Starting With Matlab
Section: Chapter Questions
Problem 1P

Related questions
Question
c. Identify the factors affecting the endogenous variables. Leave blank if variable is exogenous.
W: __________
X: __________
Y: __________
Z: __________
A: __________
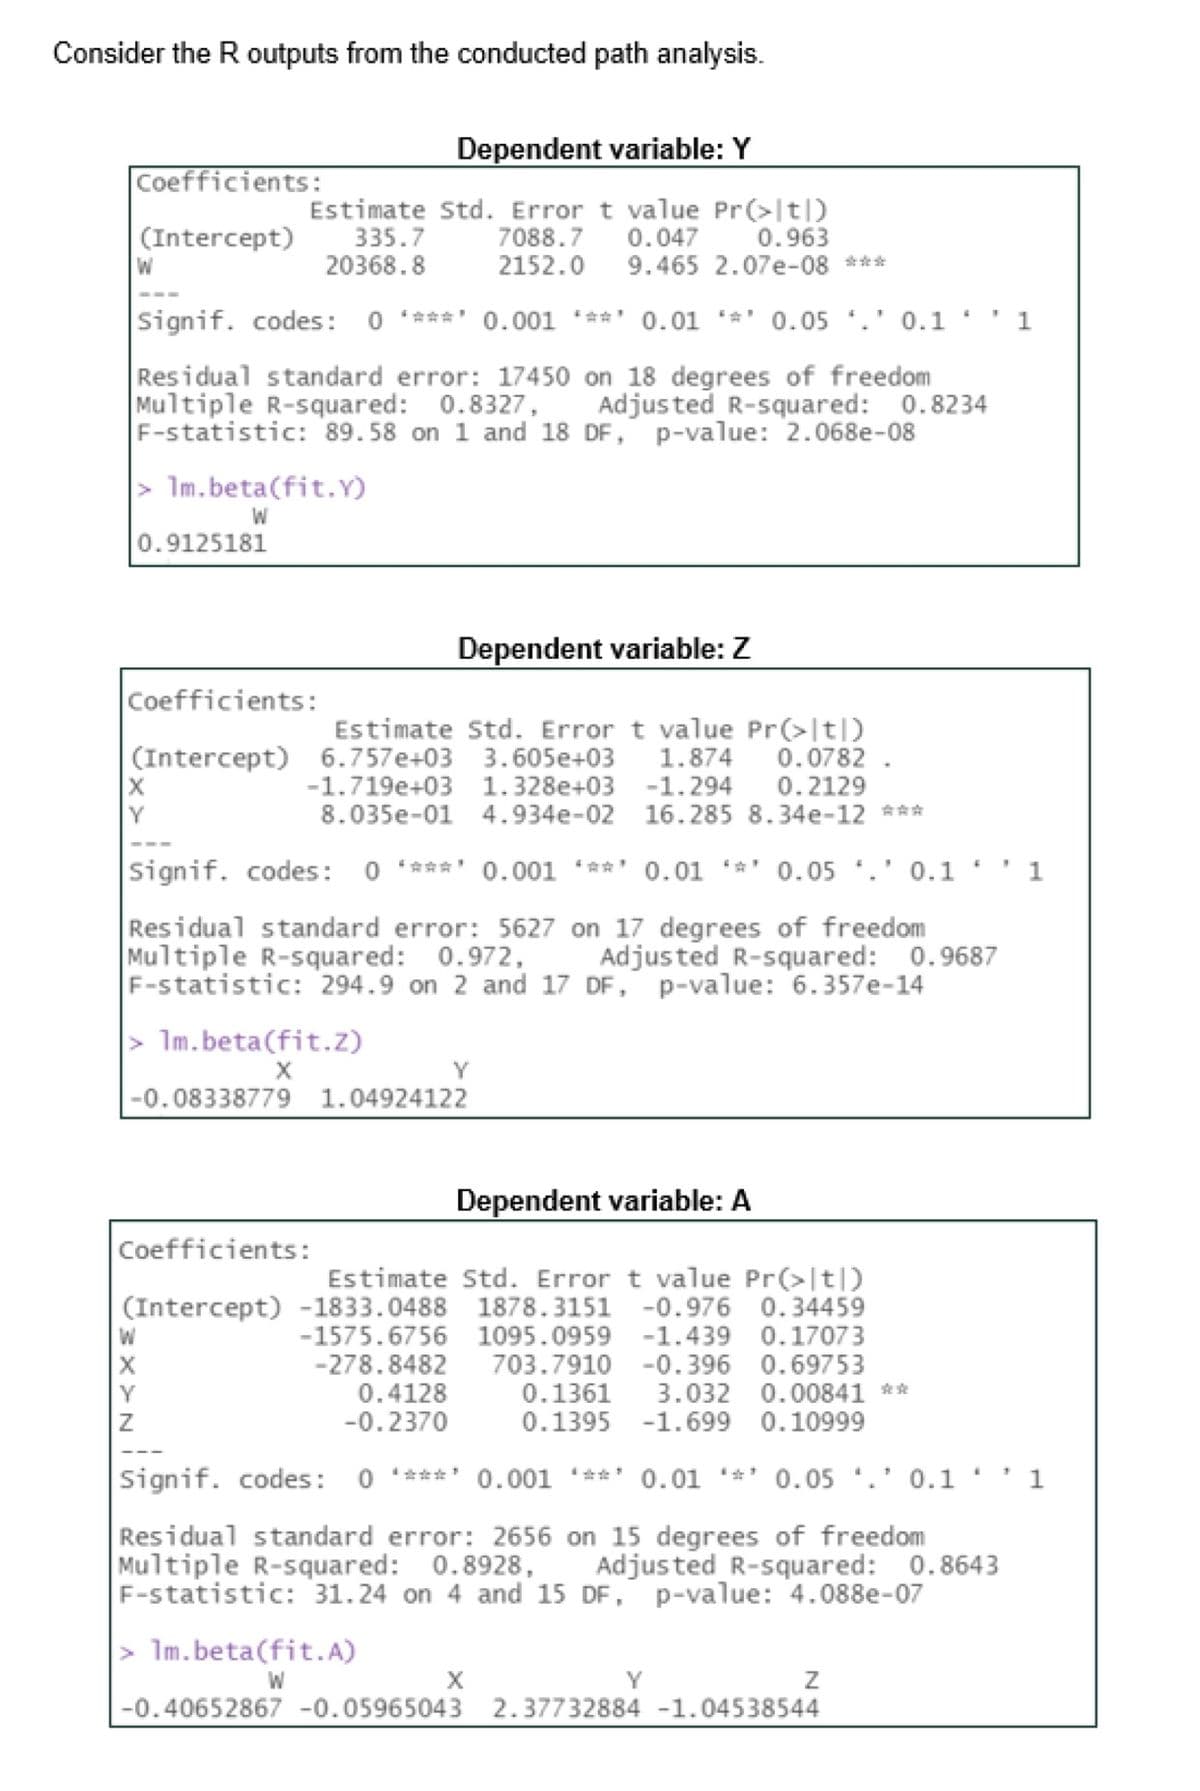
Transcribed Image Text:Consider the R outputs from the conducted path analysis.
Coefficients:
(Intercept)
W
Dependent variable: Y
Estimate Std. Error t value Pr(>|t|)
0.963
335.7
7088.7 0.047
20368.8
2152.0
Signif. codes: 0 **** 0.001 ***0.01 *** 0.05 *.' 0.1*
Residual standard error: 17450 on 18 degrees of freedom
Multiple R-squared: 0.8327, Adjusted R-squared: 0.8234
F-statistic: 89.58 on 1 and 18 DF, p-value: 2.068e-08
> 1m.beta(fit.Y)
W
0.9125181
Coefficients:
(Intercept)
X
Y
Z
> 1m.beta(fit.z)
X
Estimate Std. Error t value Pr(>|t|)
6.757e+03 3.605e+03
1.874
-1.719e+03 1.328e+03 -1.294
8.035e-01
Dependent variable: Z
9.465 2.07e-08 ***
Signif. codes: 0 ***** 0.001 **** 0.01 *** 0.05.' 0.11
Residual standard error: 5627 on 17 degrees of freedom
Multiple R-squared: 0.972,
Adjusted R-squared: 0.9687
F-statistic: 294.9 on 2 and 17 DF, p-value: 6.357e-14
-0.08338779 1.04924122
Y
> 1m.beta(fit.A)
W
0.0782.
0.2129
4.934e-02 16.285 8.34e-12 ***
Coefficients:
Estimate Std. Error t value Pr(>|t|)
(Intercept) -1833.0488 1878.3151 -0.976 0.34459
-1575.6756 1095.0959 -1.439 0.17073
703.7910 -0.396 0.69753
0.1361 3.032 0.00841 **
0.1395 -1.699 0.10999
-278.8482
0.4128
-0.2370
Dependent variable: A
X
Signif. codes: 0 *****
**¹0.001 **** 0.010.05.0.1'1
Residual standard error: 2656 on 15 degrees of freedom
Multiple R-squared: 0.8928, Adjusted R-squared:
F-statistic: 31.24 on 4 and 15 DF, p-value: 4.088e-07
1
-0.40652867 -0.05965043 2.37732884 -1.04538544
2.37732884 -1.04538544
0.8643
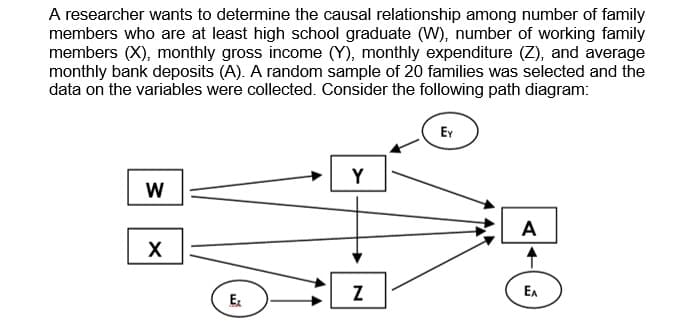
Transcribed Image Text:A researcher wants to determine the causal relationship among number of family
members who are at least high school graduate (W), number of working family
members (X), monthly gross income (Y), monthly expenditure (Z), and average
monthly bank deposits (A). A random sample of 20 families was selected and the
data on the variables were collected. Consider the following path diagram:
W
X
Ex
Y
Z
Ey
A
EA
Expert Solution
This question has been solved!
Explore an expertly crafted, step-by-step solution for a thorough understanding of key concepts.

Step by step
Solved in 2 steps

Recommended textbooks for you
MATLAB: An Introduction with Applications
Statistics
ISBN:
9781119256830
Author:
Amos Gilat
Publisher:
John Wiley & Sons Inc

Probability and Statistics for Engineering and th…
Statistics
ISBN:
9781305251809
Author:
Jay L. Devore
Publisher:
Cengage Learning

Statistics for The Behavioral Sciences (MindTap C…
Statistics
ISBN:
9781305504912
Author:
Frederick J Gravetter, Larry B. Wallnau
Publisher:
Cengage Learning
MATLAB: An Introduction with Applications
Statistics
ISBN:
9781119256830
Author:
Amos Gilat
Publisher:
John Wiley & Sons Inc
Probability and Statistics for Engineering and th…
Statistics
ISBN:
9781305251809
Author:
Jay L. Devore
Publisher:
Cengage Learning
Statistics for The Behavioral Sciences (MindTap C…
Statistics
ISBN:
9781305504912
Author:
Frederick J Gravetter, Larry B. Wallnau
Publisher:
Cengage Learning

Elementary Statistics: Picturing the World (7th E…
Statistics
ISBN:
9780134683416
Author:
Ron Larson, Betsy Farber
Publisher:
PEARSON

The Basic Practice of Statistics
Statistics
ISBN:
9781319042578
Author:
David S. Moore, William I. Notz, Michael A. Fligner
Publisher:
W. H. Freeman

Introduction to the Practice of Statistics
Statistics
ISBN:
9781319013387
Author:
David S. Moore, George P. McCabe, Bruce A. Craig
Publisher:
W. H. Freeman