4. Suppose a farm randomly selected 18 watermelons from their harvest and recorded the following weights (in pounds): 21.3, 22.1, 23.4, 18.1, 15.6, 24.1, 20.3, 20.8, 16.4 19.2, 19.8, 21.5, 21.6, 23.2, 24.1, 23.8, 23.5, 19.9 a. Draw a histogram by hand for these data using a bin width of 2. Be sure to label your axes and include even scales. b. Using the Calculator Soup website, report the mean, standard deviation, five- number summary and interquartile range of these data. Include the units for these values. c. Draw a box plot by hand for these data. Be sure to label your axis and include an even scale.
4. Suppose a farm randomly selected 18 watermelons from their harvest and recorded the following weights (in pounds): 21.3, 22.1, 23.4, 18.1, 15.6, 24.1, 20.3, 20.8, 16.4 19.2, 19.8, 21.5, 21.6, 23.2, 24.1, 23.8, 23.5, 19.9 a. Draw a histogram by hand for these data using a bin width of 2. Be sure to label your axes and include even scales. b. Using the Calculator Soup website, report the mean, standard deviation, five- number summary and interquartile range of these data. Include the units for these values. c. Draw a box plot by hand for these data. Be sure to label your axis and include an even scale.

Holt Mcdougal Larson Pre-algebra: Student Edition 2012
1st Edition
ISBN:9780547587776
Author:HOLT MCDOUGAL
Publisher:HOLT MCDOUGAL
Chapter11: Data Analysis And Probability
Section11.5: Interpreting Data
Problem 1C

Related questions
Question
urgently need
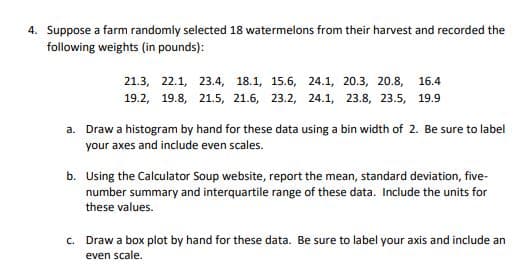
Transcribed Image Text:4. Suppose a farm randomly selected 18 watermelons from their harvest and recorded the
following weights (in pounds):
21.3, 22.1, 23.4, 18.1, 15.6, 24.1, 20.3, 20.8, 16.4
19.2, 19.8, 21.5, 21.6, 23.2, 24.1, 23.8, 23.5, 19.9
a. Draw a histogram by hand for these data using a bin width of 2. Be sure to label
your axes and include even scales.
b. Using the Calculator Soup website, report the mean, standard deviation, five-
number summary and interquartile range of these data. Include the units for
these values.
Draw a box plot by hand for these data. Be sure to label your axis and include an
even scale.
C.
Expert Solution
This question has been solved!
Explore an expertly crafted, step-by-step solution for a thorough understanding of key concepts.

This is a popular solution!

Trending now
This is a popular solution!

Step by step
Solved in 4 steps with 2 images

Recommended textbooks for you
Holt Mcdougal Larson Pre-algebra: Student Edition…
Algebra
ISBN:
9780547587776
Author:
HOLT MCDOUGAL
Publisher:
HOLT MCDOUGAL

College Algebra (MindTap Course List)
Algebra
ISBN:
9781305652231
Author:
R. David Gustafson, Jeff Hughes
Publisher:
Cengage Learning
Holt Mcdougal Larson Pre-algebra: Student Edition…
Algebra
ISBN:
9780547587776
Author:
HOLT MCDOUGAL
Publisher:
HOLT MCDOUGAL
College Algebra (MindTap Course List)
Algebra
ISBN:
9781305652231
Author:
R. David Gustafson, Jeff Hughes
Publisher:
Cengage Learning