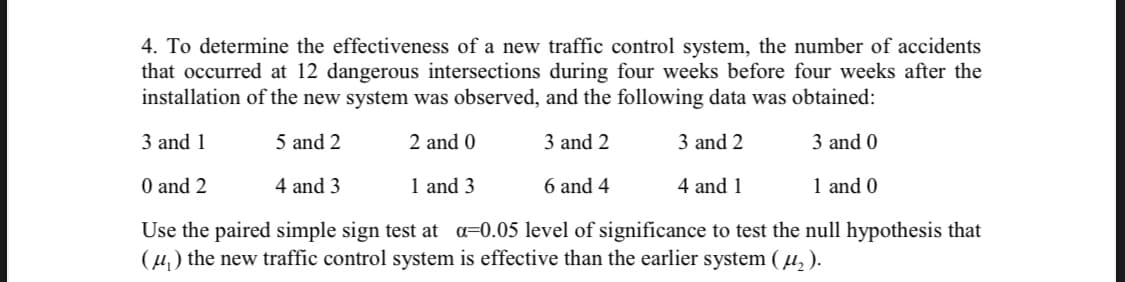
4. To determine the effectiveness of a new traffic control system, the number of accidents that occurred at 12 dangerous intersections during four weeks before four weeks after the installation of the new system was observed, and the following data was obtained: 3 and 1 5 and 2 2 and 0 3 and 2 3 and 2 3 and 0 O and 2 4 and 3 1 and 3 6 and 4 4 and 1 1 and 0 Use the paired simple sign test at a=0.05 level of significance to test the null hypothesis that (µ) the new traffic control system is effective than the earlier system (u, ).
Q: the superintendent of a school district decided to collect data on the effectiveness of two methods…
A: The provided information is:
Q: 2 6. Investigate the association between eye colour of husbands and eye colour of wives from the…
A:
Q: The researcher is concerned that older persons may not be knowledgeable of the COFLU-20. As such, he…
A: Given information- We have given a table showing knowledge level of respondents, by age group.…
Q: The quality manager believes there may be a relationship between the experience level of an…
A: There are two variables which are decision and experience level. Decision has two types which are…
Q: Which of the following is true about an observational prospective cohort study being designed to…
A: Given information: It is given that an observational prospective cohort study is being designed to…
Q: 4. A bank president claims that the median of debt-to-equity ratio of commercial loans provided is…
A: As you have posted multiple questions, We have provided answer for first question only as per our…
Q: In a study designed to examine the effectiveness of a social skills program for children, 20…
A: Since you have posted a question with multiple sub-parts, we will solve first three sub-parts for…
Q: In the Salsberry (2003) study shared in this weeks module, the researcher presents the following…
A: Chi-square test for “Goodness of fit”:The Chi-square test for “Goodness of fit” is used to test the…
Q: To test the fairness of law enforcement in its area, a local citizens' group wants to know whether…
A: Here We have write the null and alternative hypothesis
Q: the standard deviation of the matched-pair differences is ________.
A: First we have to determine the difference between two observations for each student i.e d =…
Q: 2) A department store, A, has four competitors: B, C, D, and E. Store A hires a consultant to…
A: i) Hypotheses: The null hypothesis is: H0 : The proportion are really same. ii) The alternative…
Q: To test the fairness of law enforcement in its area, a local citizens' group wants to know whether…
A:
Q: 1. The following table summarizes data collected in a study to evaluate a new screening test for…
A: According to our guidelines we can answer only three subparts, or first question and rest can be…
Q: s there a relation between incidents of child abuse and number of runaway children? A random sample…
A: To test the claim that there is a monotone-increasing relationship between the ranks of incidents of…
Q: 5. A teacher wants to test three different teaching methods: I, III and II. To do this, three groups…
A: There are 3 independent samples which are method I, method II and method III. We have to test…
Q: Which New Jersey universities have students with higher GPAs? A researcher compares the GPA of 20…
A: Use the given data to form the Anova table: Source Sum of squares Degree of freedom Mean square…
Q: A problem with a phone line that prevents a customer from receiving or making calls is upsetting to…
A: Since you have posted a question with multiple sub-parts, we will solve first three sub- parts for…
Q: Mr. James, president of Daniel-James Financial Services, believes that there is a relationship…
A: y is the (dependent or response) variable And x is the (independent or explanatory) variable.…
Q: 1. Is there a relationship between buying organic produce and having a college degree for males and…
A: As per our guidelines, we are allowed to answer first question only. Thanks 1) The row and column…
Q: To investigate the association between eye-colour of husband and eye-colour of wife, the following…
A:
Q: (a) The researcher is concerned that older persons may not be knowledgeable of the COFLU-20. As…
A:
Q: 21. A Canadian railway company claims that its trains block crossings no more than 8 minutes per…
A: Data 10.1,9.5,6.5,8,8.8,12,7.2,10.5,8.2,9.3
Q: The following are the ratings of males by females in an experiment involving speed dating. Use the…
A: Given data 2, 2.5, 3, 3.5, 4.5, 4.5, 5, 5, 5, 5, 5, 6, 7, 8, 8, 8, 9, 10, 10,10
Q: The registrar at Cow Catcher College in interested in the relationship between academic achievement…
A:
Q: A problem with a phone line that prevents a customer from receiving or making calls is upsetting to…
A: Solution Given data West Office East Office 1.52 4.55 1.75 3.75 0.78 0.10 2.85 1.10…
Q: a) Persons who visit the restroom of a certain fast-food outlet were asked to state their opinion of…
A: Given : Claim : There is an association between the gender of persons and their opinion.
Q: 10.24 The question of whether the sexual orientation of the mother has an impact on the sexual…
A: a) The populations of interest in this study is lesbian mothers and heterosexual single mothers.
Q: If a researcher randomly assigns subjects in a taste-testing study to Group 1 (Coke) or to Group 2…
A: Solution according to the guidelines we solve first question only
Q: 4) The following table gives the percentage of students registered in a specific math class for the…
A: It is needed to test the claim that the current registration percentages are the same as the ones in…
Q: 10.24 The question of whether the sexual orientation of the mother has an impact on the sexual…
A: a) The populations of interest in this study are sexual orientation of the mothers and the sexual…
Q: 4. A professor claimed that there was no difference in (population) mean college grade- point…
A: Given data is :
Q: (a) Supposen = 6 and the sample correlation coefficient is r = 0.870. Is r significant at the 1%…
A: To test the significance of Correlation Coefficient, the following is the test statistic t =…
Q: To compare customer satisfaction levels of two competing cable television companies, 174 customers…
A: We have given that Sample size n1=174 , n2= 355 Sample mean xbar1 = 3.51 , xbar2 = 3.24 Standard…
Q: 15. The researchers cited in the previous problem (Liguori and Robinson, 2001) also examined the…
A: Given: μ=400σ=40M=392n=36α=0.05
Q: To investigate the association between eye-colour of husband and eye- colour of wife, the following…
A: Solution:
Q: 1. (a) Consider an experiment in which a battery from a pack of 10 batteries is tested using a…
A: Given:10 batteries are tested using a multimeter until one with an acceptable voltage(S).Find:Sample…
Q: How would you interpret these results for Groups 2 and 3? A post hoc test was not required…
A: Null hypothesis: There is no difference between group 2 and group 3 in the ability to perform the…
Q: To test the fairness of law enforcement in its area, a local citizens' group wants to know whether…
A:
Q: If a study measures two groups on each of 100 variables, and the experimenter carries out a t test…
A: We have to find true option.
Q: Suppose a researcher conducting a follow up study obtains a sample of n = 25 students classified as…
A: Solution: Given information: n= 36 Sample size of overweight students M= 4.48 Sample mean of…
Q: The results of a random sample of children with pain from musculoskeletal injuries treated wit…
A: The following cross tabulation have been provided. The row and column total have been calculated and…
Q: 2. An investor in the telecommunications industry has been provided with some questionable…
A: The following data is given, Average monthly data usage(GB) 100 110 120 130 140 150 160 160 170…
Q: b) Persons who visit the restroom of a certain fast-food outlet were asked to state their opinion of…
A:
Q: 3. The following table is based on automobile accident records in 1988, supplied by the state of…
A: (a) The objective is to find the log linear model that describes the data. First, enter the data in…
Q: To compare the customer satisfaction levels of two competing companies, 174 customers of company 1…
A: Hi! Thank you for the question as per the honour code, we’ll answer the first question since the…
Q: Which of the following studies uses a matched-subjects design? A)None of the other options is a…
A: Matched pair design is used to compare the two different groups by matching similar conditions (or)…
Step by step
Solved in 2 steps
- A U.S. Food Survey showed that Americans routinely eat beef in their diet. Suppose that in a study of 49 consumers in Illinois and 64 consumers in Texas the following results were obtained from two samples regarding average yearly beef consumption: Illinois Texas = 49 = 64 = 54.1lb = 60.4lb S1 = 7.0 S2 = 8.0 Formulate a hypothesis so that, if the null hypothesis is rejected, we can conclude that the average amount of beef eaten annually by consumers in Illinois is significantly less than that eaten by consumers in Texas.Which New Jersey universities have students with higher GPAs? A researcher compares the GPA of 20 randomly selected students from each of the following 3 schools: Seton Hall, TCNJ, and Rowan. The mean GPAs were as follows: Seton Hall = 3.12, TCNJ = 3.39, Rowan = 2.90. (These are all made up, by the way.) SSwithin = 18.39 and SSbetween = 2.24. What can the researcher conclude at alpha .05?A researcher wishes to see whether there is any difference in the weight gains of athletes following one of three special diets. Athletes are randomly assigned to three groups and placed on the diet for 6 weeks. The weight gains (in pounds) are shown here. What can be concluded here? Diet A Diet B Diet C 3 10 8 6 12 3 7 11 2 4 14 5 8 6 A) At a 5% level of significance, there is enough evidence to reject the null hypothesis that there is no difference in the diets. B) The data prove that there is a difference in the diets. C) The data prove that there is no difference in the diets. D) A) At a 5% level of significance, there is not enough evidence to reject the null hypothesis that there is no difference in the diets E) None of the choices
- Suppose a research study uses two independent groups with 31 participants in each group. If a t-test analysis produces a calculated value of t of 2.22, which of the following is the correct decision? A. At the .05 level of significance, reject the null hypothesisB. At the .05 level of significance, fail to reject the null hypothesisC. At the .01 level of significance, reject the null hypothesisD. Impossible to answer without additional informationThe test statistic of z=2.19 is obtained when testing the claim that p>0.1. a. Identify the hypothesis test as being two-tailed, left-tailed, or right-tailed. b. Find the P-value. c. Using a significance level of α=0.05, should we reject H0 or should we fail to reject H0?A company manager wants to compare the satisfaction levels of his customers from two stores belonging to his company. According to his research, 249 out of 300 people are satisfied with shop A, and 348 out of 400 people are satisfied with shop B. Which of the following hypothesis states that there is a significant difference between customer satisfaction levels? H0 : P1 < P2, H1 : P1 ≥ P2 H0 : P1 ≥ P2, H1 : P1 < P2 H0 : P1 > P2, H1 : P1 < P2 H0 : P1 = P2, H1 : P1 ≠ P2 H0 : P1 ≠ P2, H1 : P1 < P2
- (a) The researcher is concerned that older persons may not be knowledgeable of the COFLU-20. As such, he is interested in investigating the association between the age of the respondents and their knowledge level. Table 2 below shows the knowledge level of respondents, by age group. Conduct a test, at the 5% level of significance, to determine whether the data provided sufficient evidence to conclude that an association exists between age group and knowledge level. (i) State the hypotheses to be tested: H0: H1: Calculate: (ii) state the degrees of freedom for this test (iii) the p-value for this test, given that the chi-square test statistic, c2, is 11.029. (iv) state the conclusion for the test. Give reason for your answer.Two samples of rats are timed for their maze running time. One group is taking a drug and the other is not. The times are given in the following table: Rats with drug Rats w/o drug 15 11 12 13 13 9 12 6 10 11 11 Determine whether the use of the test drug results in a different maze running time. Use the .05 level of significance. Question: How should the alternative hypothesis be stated? The test drug results of the rats who are given drugs ___ test drug result of the rats who were not given drugs. A. ≠ B. > C. <A researcher investigates whether cold medication effects mental alertness. It is known that scores on a standardized test containing a variety of problem-solving tasks are normally distributed with = 64 and = 8. A random sample of n = 16 teenage and a sample of n = 25 adults are given the drug and then tested. On average, the teenagers scored and average of ? = 58 and the adults scored and average of M = 65.5.a. Are the data sufficient to conclude that the medication significantly reduces mental alertness in teenagers? Test with = .01.b. Are the data sufficient to conclude that the medication significantly increases mental alertness in adults? Test with = .01.
- 11-The production numbers for five days in a factory producing three different products are given in the Table. Production numbers do not satisfy parametric assumptions . When investigating whether there is a difference between the production numbers of different products at the 0.05 significance level, which of the following is the test statistic? A) 6,43 B) 13,38 C) 10,53 D) 1,72 E) 2,56The test statistic of z=2.42 is obtained when testing the claim that p>0.1. a- identify the hypothesis test as being two-tailed, left-tailed or right tailed b- Find the P value c- Using a significance level of a=0.05, should we reject Ho or should we fail to reject Ho?A random sample of 15 male students and an independent random sample of 15 female students were asked to write essays at the conclusion of a writing course. These essays were then ranked from 1 (best) to 30 (worst) by a professor. The following rankings resulted: Male 26 24 15 16 8 29 12 6 18 11 13 19 10 28 7 Female 22 2 17 25 14 21 5 30 3 9 4 1 27 23 20 Test the null hypothesis that in the aggregate the two genders are equally ranked against a two-sided alternative.