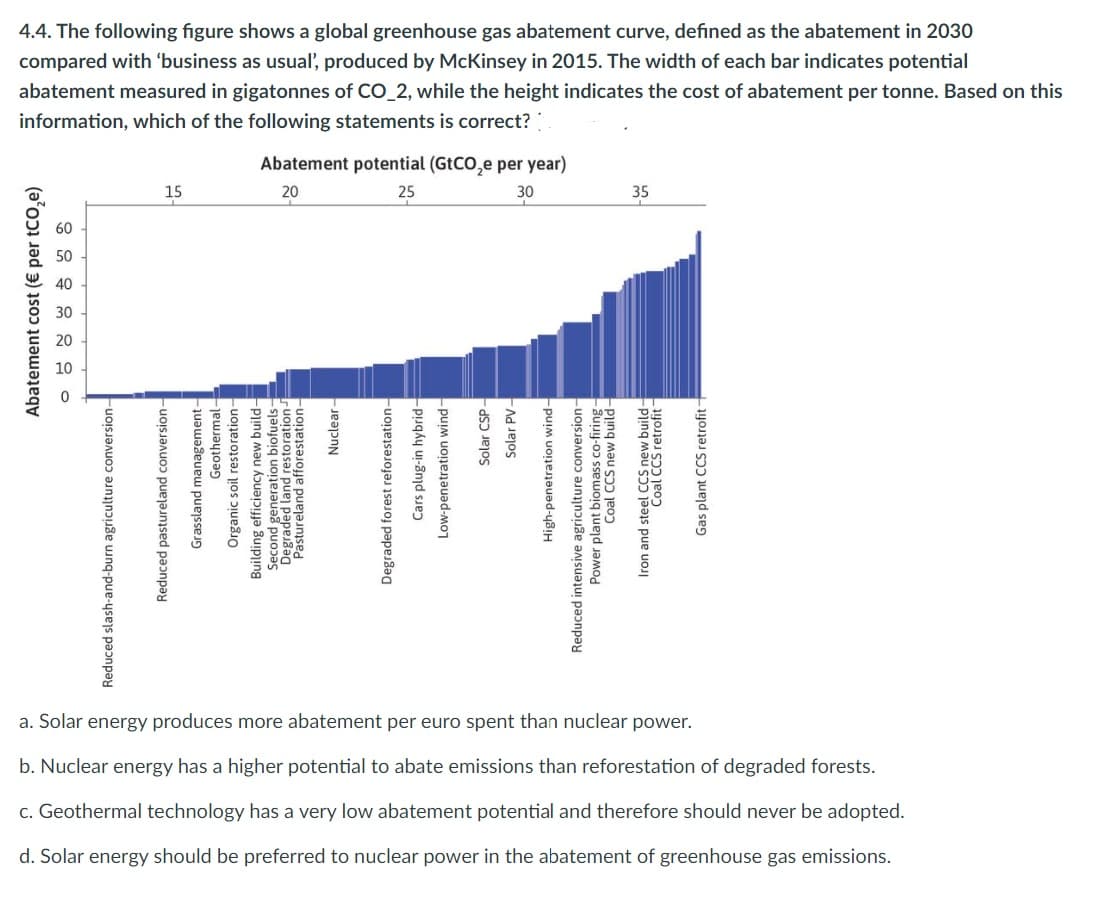
4.4. The following figure shows a global greenhouse gas abatement curve, defined as the abatement in 2030 compared with 'business as usual', produced by McKinsey in 2015. The width of each bar indicates potential abatement measured in gigatonnes of CO 2, while the height indicates the cost of abatement per tonne. Based on this information, which of the following statements is correct? Abatement potential (6+60o por voar!
4.4. The following figure shows a global greenhouse gas abatement curve, defined as the abatement in 2030 compared with 'business as usual', produced by McKinsey in 2015. The width of each bar indicates potential abatement measured in gigatonnes of CO 2, while the height indicates the cost of abatement per tonne. Based on this information, which of the following statements is correct? Abatement potential (6+60o por voar!

Chapter1: Introducing The Economic Way Of Thinking
Section: Chapter Questions
Problem 10SQ

Related questions

Question
E5
Transcribed Image Text:4.4. The following figure shows a global greenhouse gas abatement curve, defined as the abatement in 2030
compared with 'business as usual', produced by McKinsey in 2015. The width of each bar indicates potential
abatement measured in gigatonnes of CO_2, while the height indicates the cost of abatement per tonne. Based on this
information, which of the following statements is correct?
Abatement cost (€ per tCO₂e)
60
Reduced slash-and-burn agriculture conversion-
15
Geothermal-
Reduced pastureland conversion-
Grassland management-
Organic soil restoration-
Abatement potential (GtCO₂e per year)
20
25
30
Building efficiency new build-
eanioid Toneauas puores
Nuclear-
Pastureland afforestation-
Degraded forest reforestation-
Cars plug-in hybrid-
Low-penetration wind-
Solar CSP-
Solar PV-
High-penetration wind-
Coal CCS new build-
Power plant biomass co-firing-
Reduced intensive agriculture conversion-
35
Iron and steel CCS new build-
Coal CCS retrofit
Gas plant CCS retrofit-
a. Solar energy produces more abatement per euro spent than nuclear power.
b. Nuclear energy has a higher potential to abate emissions than reforestation of degraded forests.
c. Geothermal technology has a very low abatement potential and therefore should never be adopted.
d. Solar energy should be preferred to nuclear power in the abatement of greenhouse gas emissions.
Expert Solution
This question has been solved!
Explore an expertly crafted, step-by-step solution for a thorough understanding of key concepts.

Step by step
Solved in 2 steps

Knowledge Booster


Learn more about
Need a deep-dive on the concept behind this application? Look no further. Learn more about this topic, economics and related others by exploring similar questions and additional content below.Recommended textbooks for you


Economics (MindTap Course List)
Economics
ISBN:
9781337617383
Author:
Roger A. Arnold
Publisher:
Cengage Learning