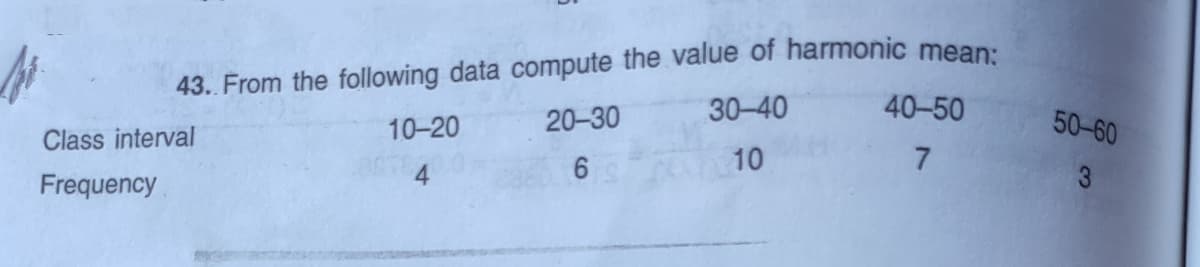
43. From the following data compute the value of harmonic mean: 40-50 30-40 10-20 20-30 50-60 Class interval 6 10 7. Frequency
Q: Suppose that a 99% interval estimate for the true mean of time (in minutes) spent viewing the exam…
A: Given data: Confidence level = 99 % Sample size (n) = 10 Given Confidence interval: Lower Bound =…
Q: Calculate the mean deviation (from mean) of the following series: Marks 15 25 35 45 No. of students…
A:
Q: 4. From the following data compute arithmetic mean by direct method: Marks 0-10 10-20 20-30 30-40…
A:
Q: 25. Find Median from the following frequency distribution. Classes More More More More More More…
A:
Q: From the following data, calculate Harmonic Mean : Class-interval : 10-20 20-30 30-40 40-50 50-60…
A: We have given that, Class interval 10-20 20-30 30-40 40-50 50-60 Frequency 30 75 70 135 220
Q: 3. For a group of 100 candidates the mean and standard deviation of their marks were found to be 60…
A: Given: There are 100 candidates mean of their marks = 60 Standard deviation of marks = 15 Wrong…
Q: Q4: The frequency distribution of weights of 190 sorghum ear-heads is given below. Compute Harmonic…
A: Formula Used: Harmonic mean = ∑f∑fx where 'f' is the frequency, And 'x' is the mid value x = Lower…
Q: 45. The median of the following data is 28. Find the missing frequency Scores 0-10 10-20 20-30 30-40…
A:
Q: Suppose you have values on variable equal to , and wish to compute a measure of variation from the…
A:
Q: For the following, the data set has a mean of μ=100 and a standard deviation of σ=20. Find the…
A:
Q: 13. From the following frequency distribution given the temperature in different days. Find mean.…
A:
Q: I have no clue..
A: Given data and calculation for the mean and standard deviation is shown below
Q: Compute the Harmonic mean of the following values: 15, 250, 15.7, 157, 1.57, 105.7, 105, 1.06, 25.7,…
A:
Q: s known that o = 2.15 pounds. %3D sample should be taken to be 93% confident that the sample mean is…
A: The sample size can be calculated as: n=z×σE2 Here, z = desired confidence level E = The allowable…
Q: 142. From the following data compute the value of harmonic mean : Marks 10 20 25 40 50 No. of…
A:
Q: For certain table which has only been partly reproduced, mean was found to be seltelvab as 1.46. No.…
A: Given data isMean = 1.46 No. of Accidents(x) 0 1 2 3 4 5 Frequency(f) 46 f1 f2 25 10 5 N=200…
Q: The following figure is a histogram of the number of servings of fruit per day claimed by 74…
A: Mean: Mean is the expected value of a set of observations. In other words, mean is he average of the…
Q: Find the harmonic Mean for the following data: Class 10-20 20-30 30-40 40-50 50-60 60-70 70-80 80-90…
A: The harmonic mean is computed by x¯=∑f∑fx, where f is the frequency of x value. Because the data…
Q: 8 Assume total cholesterol value for a certain population is approximately bell shaped with a mean…
A: Consider,X be a total cholesterol value that follows normally distribution with man of 200mg/ 100ml…
Q: Suppose that 100 randomly selected members of the Karaoke channel were asked how much time they…
A: We know that confidence interval for mean is given by, (X bar +-z*sigma/√n) Where x bar is mean,…
Q: The following table gives the frequency distribution of prices for a sample of 30 college textbooks.…
A: From the given data: Price Midpoint (x) f xf 20-30 25 4 100 30-40 35 7 245 40-50 45 13 585…
Q: The median and the mode of the following distribution are known to be $.335 and $340, respectively.…
A:
Q: Find mean for the following data : 40-49 30-39 20-29 10-19 0-9 Class-interval: 50-59 Frequency 3 8…
A: From the provided information, Class-interval 50-59 40-49 30-39 20-29 10-19 0-9…
Q: (a) The mean and S.D of a set of 100 observations were worked out as 40 and 5 respectively. But by…
A:
Q: Find the mean for the following data: Student Age (years) Number of Students 18 - 20 21 - 23 230 152…
A:
Q: he arithmetic mean for the following distribution Class Intervals Frequency 5-10 7 10- 15 1 15- 20…
A: Given: Class Interval Frequency 5-10 7 10-15 1 15-20 5 20-25 3 25-30 8 To find…
Q: When we add the data value 21 to the original Set A, the data values in this new data set can be…
A: Consider that the random variable x of size n, that is, x1, x2, …, xn. Thus, the mean is defined as…
Q: Refer to the slot depth in Table 1 below. After the machine was repaired, a sample of three new…
A: From the given information we have Time 6:30 7:00 7:30 8:00 8:30 9:00 9:30 10:00 1 214 218…
Q: 2. A student gets the following grades in his seven subjects: 87 for Calculus, 82 for Physics, 79…
A: We have given the following data.
Q: Assume that the length of human pregnancies from conception to birth varies according to a…
A:
Q: The following is a histogram showing the distribution pe caused by tornadoes, over the period 1950…
A: For the data and the histogram, the class intervals are 0to<10,10 to <20, and so on. Mean or…
Q: Suppose that, for a certain exam, a teacher grades on a curve. It is known that the mean is 65…
A: According to Empirical rule, middle 68.2% of students receive C. Nreceive C=0.682×25…
Q: The data concerning height measurement for a random sample of individuals from a given population…
A:
Q: Find mean for the following data : Class-interval: Frequency: 50-59 40-49 30-39 20-29 10-19 0-9 3 10…
A: Given, Class-interval Frequency (f) mid values (x) f.x 50-59 1 54.5 54.5 40-49 3 44.5 133.5…
Q: From the following data compute the value of harmonic mean : Marks 10 20 25 40 No. of students 50 20…
A:
Q: Which of the following statements is NOT TRUE regarding the calculating of the median of a data set.…
A: True statements Before the median (or midpoint) of a data set can be determined, the quantitative…
Q: Please, find Harmonic Mean of the given data. ASAP Marks 10-19 20-29 30-39 40-49…
A: Given Marks 10-19 20-29 30-39 40-49 50-59 Number of students 05 25 40…
Q: 28. Find the missing frequencies of the following data. The average marks of 100 students as per…
A:
Q: 1. The number of cars X, used for official business purposes on any given workday of two companies,…
A: Part a: The mean and the standard deviation for both the companies are computed as, For company A:…
Q: 27. Calculate harmonic mean from the following data: Marks: 0-10 10-20 20-30 30-40 40-50 No. of…
A:
Q: O Mean (a) For these data, which measures of O Median central tendency take more than one value?…
A: “Since you have posted a question with multiple sub-parts, we will solve first three subparts for…
Q: Q.9. Calculate missing frequencies from the following when mean is 13-75. No. of students : 4 8 10…
A:
Q: Suppose an interval estimate for the population mean was 62.84 to 69.46. The population standard…
A: Given : Interval estimate for the population mean was 62.84 to 69.46 Population standard deviation…
Q: The following is the frequency distribution of the sample weight from field of chickens in grams,…
A: The given data is, weight No. of chickens 720-700 10 700-680 20 680-660 25 660-640 20…
Q: Find the harmonic Mean for the following data: Class 10-20 20-30 30-40 40-50 50-60 60-70 70-80 80-90…
A: Mid - point(x) = Lower class limit+ Upper class limit 2 Example : Mid point…
Q: 02: Answer the following questions: a) Find the harmonic mean for the following data: 3 7 8 16 19 b)…
A: (a) To find the harmonic mean for the following data: 3, 7, 8, 16, 19 Harmonic mean is the…
Q: 2. For the following frequency table find the mean by: (i) Direct Method (ii) Short-cut Method (iii)…
A:
Q: It has been determined that there is a significant relationship between the temperature (x) and the…
A:
Q: 2. Find out (i) Mean (ii) Median and (iii) Standard Deviation for the following data. Class 10-20…
A: Given that :
Q: 20. Fred was told by his teacher that the mean final mark of all the students in his class was…
A: Frequency distribution can be either grouped or ungrouped.
Step by step
Solved in 2 steps with 2 images