5. A study was conducted using a random sample of women who gave birth between 1998 and 2000. The purpose of the study was to quantify the association between post-partum depression and subsequent health outcomes, including being homeless for at least some of the time between 2 and 3 years after giving birth. For brevity, this outcome will be referred to as "homeless" in the relevant questions. Of the 375 women who had post-partum depression, 75 were homeless. Of the 2,600 women who did not have post-partum depression, 286 were homeless. Suppose 1,000 public health graduate students were each asked to survey two women randomly selected from the population of all women who gave birth between 1998 - 2000. For each of these 1,000 samples, the proportion of the women in the sample who had been homeless was computed. A histogram was made of these 1,000 sample proportions. Which of the following statements best described this histogram? Because the size of each sample is large, this distribution should be approximately normal because of the Central Limit Theorem. Because there are 1,000 values in the histogram, the histogram should be approximately normal. Because n=2 for each sample, the histogram will have a maximum of three bars at the values 0, 2, and 1. O This cannot be answered without access to a standard normal table.
5. A study was conducted using a random sample of women who gave birth between 1998 and 2000. The purpose of the study was to quantify the association between post-partum depression and subsequent health outcomes, including being homeless for at least some of the time between 2 and 3 years after giving birth. For brevity, this outcome will be referred to as "homeless" in the relevant questions. Of the 375 women who had post-partum depression, 75 were homeless. Of the 2,600 women who did not have post-partum depression, 286 were homeless. Suppose 1,000 public health graduate students were each asked to survey two women randomly selected from the population of all women who gave birth between 1998 - 2000. For each of these 1,000 samples, the proportion of the women in the sample who had been homeless was computed. A histogram was made of these 1,000 sample proportions. Which of the following statements best described this histogram? Because the size of each sample is large, this distribution should be approximately normal because of the Central Limit Theorem. Because there are 1,000 values in the histogram, the histogram should be approximately normal. Because n=2 for each sample, the histogram will have a maximum of three bars at the values 0, 2, and 1. O This cannot be answered without access to a standard normal table.

Holt Mcdougal Larson Pre-algebra: Student Edition 2012
1st Edition
ISBN:9780547587776
Author:HOLT MCDOUGAL
Publisher:HOLT MCDOUGAL
Chapter11: Data Analysis And Probability
Section: Chapter Questions
Problem 8CR

Related questions
Topic Video
Question
only answer please
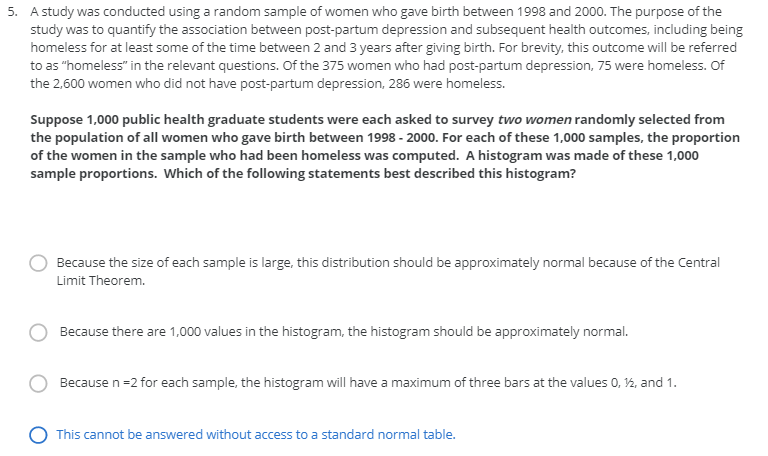
Transcribed Image Text:5. A study was conducted using a random sample of women who gave birth between 1998 and 2000. The purpose of the
study was to quantify the association between post-partum depression and subsequent health outcomes, including being
homeless for at least some of the time between 2 and 3 years after giving birth. For brevity, this outcome will be referred
to as "homeless" in the relevant questions. Of the 375 women who had post-partum depression, 75 were homeless. Of
the 2,600 women who did not have post-partum depression, 286 were homeless.
Suppose 1,000 public health graduate students were each asked to survey two women randomly selected from
the population of all women who gave birth between 1998 - 2000. For each of these 1,000 samples, the proportion
of the women in the sample who had been homeless was computed. A histogram was made of these 1,000
sample proportions. Which of the following statements best described this histogram?
Because the size of each sample is large, this distribution should be approximately normal because of the Central
Limit Theorem.
Because there are 1,000 values in the histogram, the histogram should be approximately normal.
Because n=2 for each sample, the histogram will have a maximum of three bars at the values 0, 2, and 1.
O This cannot be answered without access to a standard normal table.
Expert Solution
This question has been solved!
Explore an expertly crafted, step-by-step solution for a thorough understanding of key concepts.

This is a popular solution!

Trending now
This is a popular solution!

Step by step
Solved in 2 steps with 1 images

Knowledge Booster


Learn more about
Need a deep-dive on the concept behind this application? Look no further. Learn more about this topic, statistics and related others by exploring similar questions and additional content below.Recommended textbooks for you
Holt Mcdougal Larson Pre-algebra: Student Edition…
Algebra
ISBN:
9780547587776
Author:
HOLT MCDOUGAL
Publisher:
HOLT MCDOUGAL
Holt Mcdougal Larson Pre-algebra: Student Edition…
Algebra
ISBN:
9780547587776
Author:
HOLT MCDOUGAL
Publisher:
HOLT MCDOUGAL