5.22a: What is the effect on the power curve? Hint: See L-11 pdf and lecture, page 9-10 O1. Depending on u, the power both increases and decreases O II. The power is unchanged O III. It increases the power of the test O IV. It reduces the power of the test
5.22a: What is the effect on the power curve? Hint: See L-11 pdf and lecture, page 9-10 O1. Depending on u, the power both increases and decreases O II. The power is unchanged O III. It increases the power of the test O IV. It reduces the power of the test

Glencoe Algebra 1, Student Edition, 9780079039897, 0079039898, 2018
18th Edition
ISBN:9780079039897
Author:Carter
Publisher:Carter
Chapter10: Statistics
Section10.1: Measures Of Center
Problem 9PPS

Related questions
Question
i need mcq answer other pic is for reference
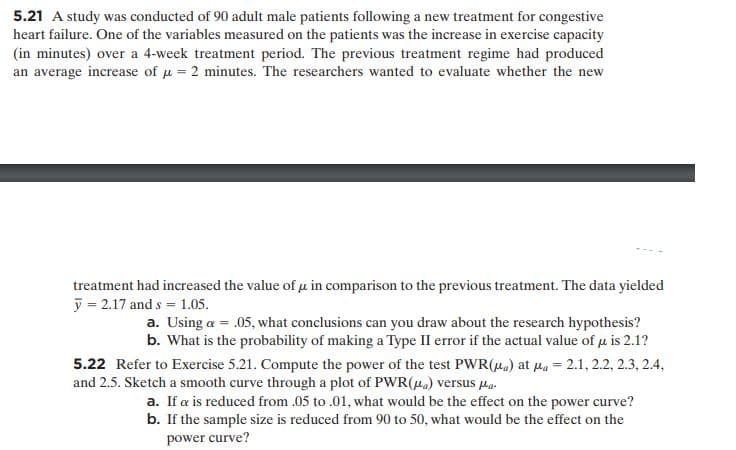
Transcribed Image Text:5.21 A study was conducted of 90 adult male patients following a new treatment for congestive
heart failure. One of the variables measured on the patients was the increase in exercise capacity
(in minutes) over a 4-week treatment period. The previous treatment regime had produced
an average increase of u = 2 minutes. The researchers wanted to evaluate whether the new
treatment had increased the value of u in comparison to the previous treatment. The data yielded
ỹ = 2.17 and s = 1.05.
a. Using a = .05, what conclusions can you draw about the research hypothesis?
b. What is the probability of making a Type II error if the actual value of u is 2.1?
5.22 Refer to Exercise 5.21. Compute the power of the test PWR(ua) at pa = 2.1, 2.2, 2.3, 2.4,
and 2.5. Sketch a smooth curve through a plot of PWR(Ha) versus pa.
a. If a is reduced from .05 to .01, what would be the effect on the power curve?
b. If the sample size is reduced from 90 to 50, what would be the effect on the
power curve?
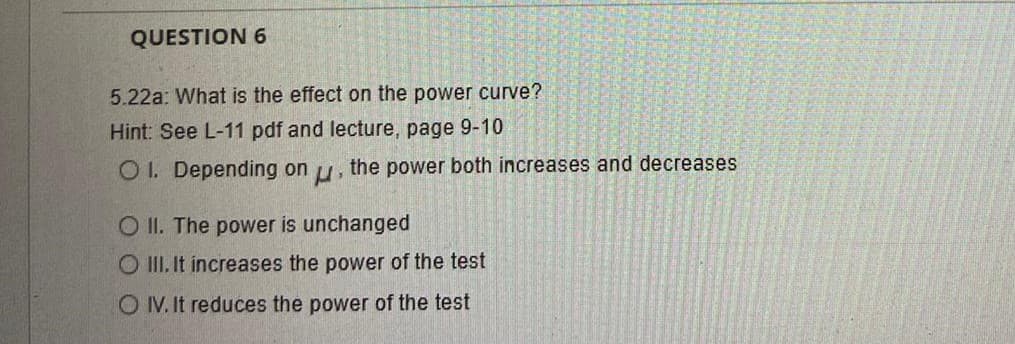
Transcribed Image Text:QUESTION 6
5.22a: What is the effect on the power curve?
Hint: See L-11 pdf and lecture, page 9-10
O 1. Depending on u, the power both increases and decreases
O II. The power is unchanged
O III. It increases the power of the test
O IV. It reduces the power of the test
Expert Solution
This question has been solved!
Explore an expertly crafted, step-by-step solution for a thorough understanding of key concepts.

Step by step
Solved in 2 steps

Recommended textbooks for you
Glencoe Algebra 1, Student Edition, 9780079039897…
Algebra
ISBN:
9780079039897
Author:
Carter
Publisher:
McGraw Hill
Glencoe Algebra 1, Student Edition, 9780079039897…
Algebra
ISBN:
9780079039897
Author:
Carter
Publisher:
McGraw Hill