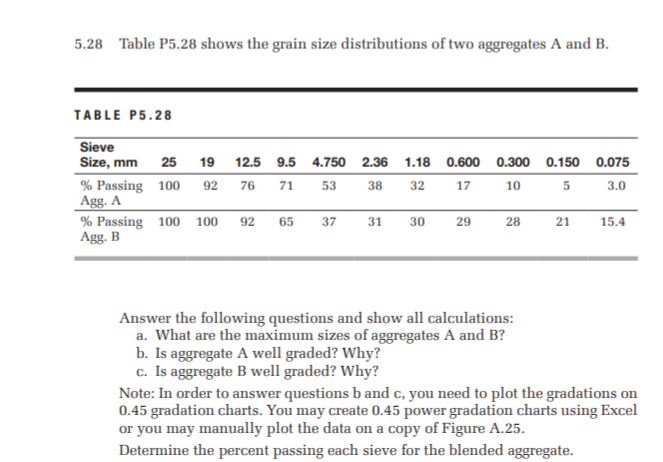
5.28 Table P5.28 shows the grain size distributions of two aggregates A and B. TABLE P5.28 Sieve Size, mm 25 19 12.5 9.5 4.750 2.36 1.18 0.600 0.300 0.150 0.075 % Passing 100 Agg. A 92 76 71 53 38 32 17 10 5 3.0 % Passing 100 Agg. B 100 92 65 37 31 30 29 28 21 15.4 Answer the following questions and show all calculations: a. What are the maximum sizes of aggregates A and B? b. Is aggregate A well graded? Why? c. Is aggregate B well graded? Why? Note: In order to answer questions b and c, you need to plot the gradations on 0.45 gradation charts. You may create 0.45 power gradation charts using Excel or you may manually plot the data on a copy of Figure A.25. Determine the percent passing each sieve for the blended aggregate.
5.28 Table P5.28 shows the grain size distributions of two aggregates A and B. TABLE P5.28 Sieve Size, mm 25 19 12.5 9.5 4.750 2.36 1.18 0.600 0.300 0.150 0.075 % Passing 100 Agg. A 92 76 71 53 38 32 17 10 5 3.0 % Passing 100 Agg. B 100 92 65 37 31 30 29 28 21 15.4 Answer the following questions and show all calculations: a. What are the maximum sizes of aggregates A and B? b. Is aggregate A well graded? Why? c. Is aggregate B well graded? Why? Note: In order to answer questions b and c, you need to plot the gradations on 0.45 gradation charts. You may create 0.45 power gradation charts using Excel or you may manually plot the data on a copy of Figure A.25. Determine the percent passing each sieve for the blended aggregate.

Chapter2: Loads On Structures
Section: Chapter Questions
Problem 1P

Related questions
Question
Transcribed Image Text:5.28 Table P5.28 shows the grain size distributions of two aggregates A and B.
TABLE P5.28
Sieve
Size, mm
25
19
12.5
9.5 4.750 2.36
1.18 0.600 0.300 0.150 0.075
% Passing 100
Agg. A
92
76
71
53
38
32
17
10
5
3.0
% Passing 100
Agg. B
100
92
65
37
31
30
29
28
21
15.4
Answer the following questions and show all calculations:
a. What are the maximum sizes of aggregates A and B?
b. Is aggregate A well graded? Why?
c. Is aggregate B well graded? Why?
Note: In order to answer questions b and c, you need to plot the gradations on
0.45 gradation charts. You may create 0.45 power gradation charts using Excel
or you may manually plot the data on a copy of Figure A.25.
Determine the percent passing each sieve for the blended aggregate.
Expert Solution
This question has been solved!
Explore an expertly crafted, step-by-step solution for a thorough understanding of key concepts.

This is a popular solution!

Trending now
This is a popular solution!

Step by step
Solved in 2 steps with 1 images

Recommended textbooks for you

Structural Analysis (10th Edition)
Civil Engineering
ISBN:
9780134610672
Author:
Russell C. Hibbeler
Publisher:
PEARSON

Principles of Foundation Engineering (MindTap Cou…
Civil Engineering
ISBN:
9781337705028
Author:
Braja M. Das, Nagaratnam Sivakugan
Publisher:
Cengage Learning
Structural Analysis (10th Edition)
Civil Engineering
ISBN:
9780134610672
Author:
Russell C. Hibbeler
Publisher:
PEARSON
Principles of Foundation Engineering (MindTap Cou…
Civil Engineering
ISBN:
9781337705028
Author:
Braja M. Das, Nagaratnam Sivakugan
Publisher:
Cengage Learning

Fundamentals of Structural Analysis
Civil Engineering
ISBN:
9780073398006
Author:
Kenneth M. Leet Emeritus, Chia-Ming Uang, Joel Lanning
Publisher:
McGraw-Hill Education


Traffic and Highway Engineering
Civil Engineering
ISBN:
9781305156241
Author:
Garber, Nicholas J.
Publisher:
Cengage Learning