6) A researcher was interested in comparing the GPAS of students at two different colleges. Independent simple random samples of 8 students from college A and 13 students from college B yielded the following GPAS. College A College B 3.7 3.8 2.8 3.2 3.2 4.0 3.0 3.0 3.6 2.5 3.9 2.6 2.7 3.8 4.0 3.6 2.5 3.6 2.8 3.9 3.4 Determine a 95% confidence interval for the difference between the mean GPAS of college A students and college B students. (Note: x1 = 3.1125, x2 = 3.4385, s1 = 0.4357, s2 = 0.5485.) Preliminary data analyses indicates that you can reasonably use nonpooled t –procedures on the given data. Apply a nonpooled t-test to perform the required hypothesis test, using either the critical -value approach or the P-value approach. 7) A researcher was interested in comparing the amount of time spent watching television by women and by men. Independent simple random samples of 14 women and 17 men were selected, and each person was asked how many hours he or she had watched television during the previous week. The summary statistics are as follows. Women Men X1 = 11.8 x2 = 13.6 s1 = 3.9 s2 = 5.2 n1 = 14| n2 = 17 At the 5% significance level, do the data provide sufficient evidence to conclude that the mean television watching time of women is less than that of men?
6) A researcher was interested in comparing the GPAS of students at two different colleges. Independent simple random samples of 8 students from college A and 13 students from college B yielded the following GPAS. College A College B 3.7 3.8 2.8 3.2 3.2 4.0 3.0 3.0 3.6 2.5 3.9 2.6 2.7 3.8 4.0 3.6 2.5 3.6 2.8 3.9 3.4 Determine a 95% confidence interval for the difference between the mean GPAS of college A students and college B students. (Note: x1 = 3.1125, x2 = 3.4385, s1 = 0.4357, s2 = 0.5485.) Preliminary data analyses indicates that you can reasonably use nonpooled t –procedures on the given data. Apply a nonpooled t-test to perform the required hypothesis test, using either the critical -value approach or the P-value approach. 7) A researcher was interested in comparing the amount of time spent watching television by women and by men. Independent simple random samples of 14 women and 17 men were selected, and each person was asked how many hours he or she had watched television during the previous week. The summary statistics are as follows. Women Men X1 = 11.8 x2 = 13.6 s1 = 3.9 s2 = 5.2 n1 = 14| n2 = 17 At the 5% significance level, do the data provide sufficient evidence to conclude that the mean television watching time of women is less than that of men?

Holt Mcdougal Larson Pre-algebra: Student Edition 2012
1st Edition
ISBN:9780547587776
Author:HOLT MCDOUGAL
Publisher:HOLT MCDOUGAL
Chapter11: Data Analysis And Probability
Section11.4: Collecting Data
Problem 2E

Related questions
Question
Please view the attached image for the problem. Please answer completely and show all work
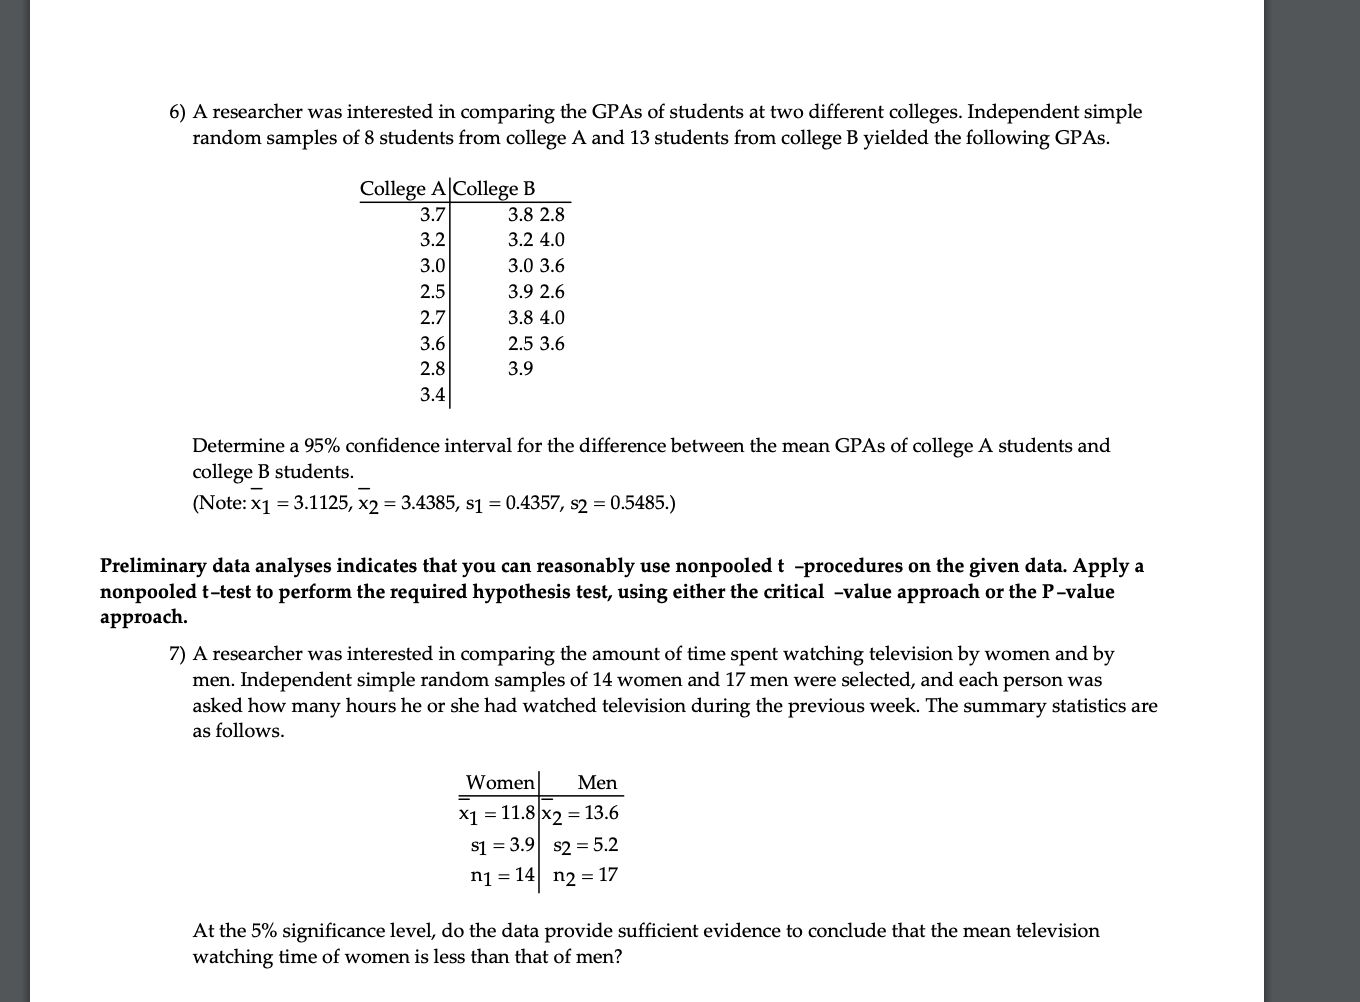
Transcribed Image Text:6) A researcher was interested in comparing the GPAS of students at two different colleges. Independent simple
random samples of 8 students from college A and 13 students from college B yielded the following GPAS.
College A College B
3.7
3.8 2.8
3.2
3.2 4.0
3.0
3.0 3.6
2.5
3.9 2.6
2.7
3.8 4.0
3.6
2.5 3.6
2.8
3.9
3.4
Determine a 95% confidence interval for the difference between the mean GPAS of college A students and
college B students.
(Note: x1 = 3.1125, x2 = 3.4385, s1 = 0.4357, s2 = 0.5485.)
Preliminary data analyses indicates that you can reasonably use nonpooled t –procedures on the given data. Apply a
nonpooled t-test to perform the required hypothesis test, using either the critical -value approach or the P-value
approach.
7) A researcher was interested in comparing the amount of time spent watching television by women and by
men. Independent simple random samples of 14 women and 17 men were selected, and each person was
asked how many hours he or she had watched television during the previous week. The summary statistics are
as follows.
Women
Men
X1 = 11.8 x2 = 13.6
s1 = 3.9 s2 = 5.2
n1 = 14| n2 = 17
At the 5% significance level, do the data provide sufficient evidence to conclude that the mean television
watching time of women is less than that of men?
Expert Solution
This question has been solved!
Explore an expertly crafted, step-by-step solution for a thorough understanding of key concepts.

This is a popular solution!

Trending now
This is a popular solution!

Step by step
Solved in 4 steps with 4 images

Knowledge Booster


Learn more about
Need a deep-dive on the concept behind this application? Look no further. Learn more about this topic, statistics and related others by exploring similar questions and additional content below.Recommended textbooks for you
Holt Mcdougal Larson Pre-algebra: Student Edition…
Algebra
ISBN:
9780547587776
Author:
HOLT MCDOUGAL
Publisher:
HOLT MCDOUGAL

Glencoe Algebra 1, Student Edition, 9780079039897…
Algebra
ISBN:
9780079039897
Author:
Carter
Publisher:
McGraw Hill

College Algebra (MindTap Course List)
Algebra
ISBN:
9781305652231
Author:
R. David Gustafson, Jeff Hughes
Publisher:
Cengage Learning
Holt Mcdougal Larson Pre-algebra: Student Edition…
Algebra
ISBN:
9780547587776
Author:
HOLT MCDOUGAL
Publisher:
HOLT MCDOUGAL
Glencoe Algebra 1, Student Edition, 9780079039897…
Algebra
ISBN:
9780079039897
Author:
Carter
Publisher:
McGraw Hill
College Algebra (MindTap Course List)
Algebra
ISBN:
9781305652231
Author:
R. David Gustafson, Jeff Hughes
Publisher:
Cengage Learning