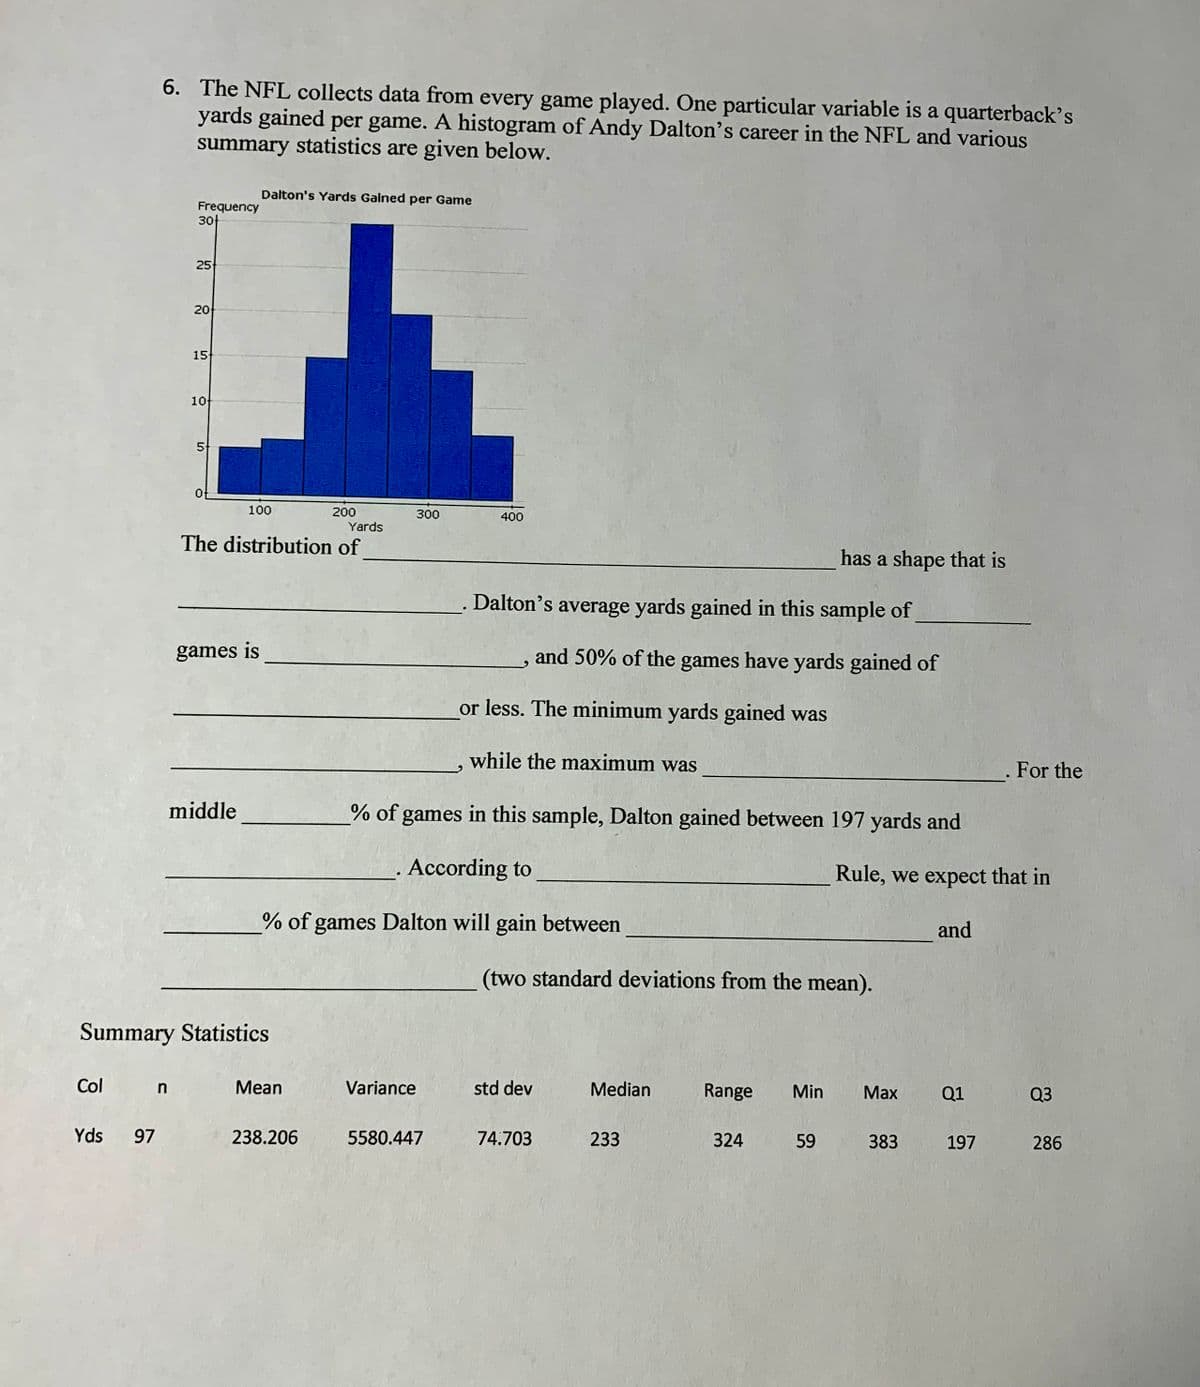
6. The NFL collects data from every game played. One particular variable is a quarterback's yards gained per game. A histogram of Andy Dalton's career in the NFL and various summary statistics are given below. Dalton's Yards Galned per Game Frequency 30 25 20 15 10 100 200 Yards 300 400 The distribution of has a shape that is Dalton's average yards gained in this sample of games is and 50% of the games have yards gained of or less. The minimum yards gained was while the maximum was For the middle % of games in this sample, Dalton gained between 197 yards and According to Rule, we expect that in % of games Dalton will gain between and (two standard deviations from the mean). Summary Statistics Col Mean Variance std dev Median n Range Min Маx Q1 Q3 Yds 97 238.206 5580.447 74.703 233 324 59 383 197 286
6. The NFL collects data from every game played. One particular variable is a quarterback's yards gained per game. A histogram of Andy Dalton's career in the NFL and various summary statistics are given below. Dalton's Yards Galned per Game Frequency 30 25 20 15 10 100 200 Yards 300 400 The distribution of has a shape that is Dalton's average yards gained in this sample of games is and 50% of the games have yards gained of or less. The minimum yards gained was while the maximum was For the middle % of games in this sample, Dalton gained between 197 yards and According to Rule, we expect that in % of games Dalton will gain between and (two standard deviations from the mean). Summary Statistics Col Mean Variance std dev Median n Range Min Маx Q1 Q3 Yds 97 238.206 5580.447 74.703 233 324 59 383 197 286

Glencoe Algebra 1, Student Edition, 9780079039897, 0079039898, 2018
18th Edition
ISBN:9780079039897
Author:Carter
Publisher:Carter
Chapter10: Statistics
Section10.4: Distributions Of Data
Problem 19PFA

Related questions

Question
Transcribed Image Text:6. The NFL collects data from every game played. One particular variable is a quarterback's
yards gained per game. A histogram of Andy Dalton’s career in the NFL and various
summary statistics are given below.
Dalton's Yards Gained per Game
Frequency
30t
25
20
15
10
5
100
200
300
400
Yards
The distribution of
has a shape that is
Dalton's average yards gained in this sample of
games is
and 50% of the games have yards gained of
or less. The minimum yards gained was
while the maximum was
For the
middle
% of games in this sample, Dalton gained between 197 yards and
According to
Rule, we expect that in
% of games Dalton will gain between
and
(two standard deviations from the mean).
Summary Statistics
Col
Mean
Variance
std dev
Median
Range
Min
Маx
Q1
Q3
Yds 97
238.206
5580.447
74.703
233
324
59
383
197
286
Expert Solution
This question has been solved!
Explore an expertly crafted, step-by-step solution for a thorough understanding of key concepts.

This is a popular solution!

Trending now
This is a popular solution!

Step by step
Solved in 2 steps

Knowledge Booster


Learn more about
Need a deep-dive on the concept behind this application? Look no further. Learn more about this topic, statistics and related others by exploring similar questions and additional content below.Recommended textbooks for you
Glencoe Algebra 1, Student Edition, 9780079039897…
Algebra
ISBN:
9780079039897
Author:
Carter
Publisher:
McGraw Hill
Glencoe Algebra 1, Student Edition, 9780079039897…
Algebra
ISBN:
9780079039897
Author:
Carter
Publisher:
McGraw Hill