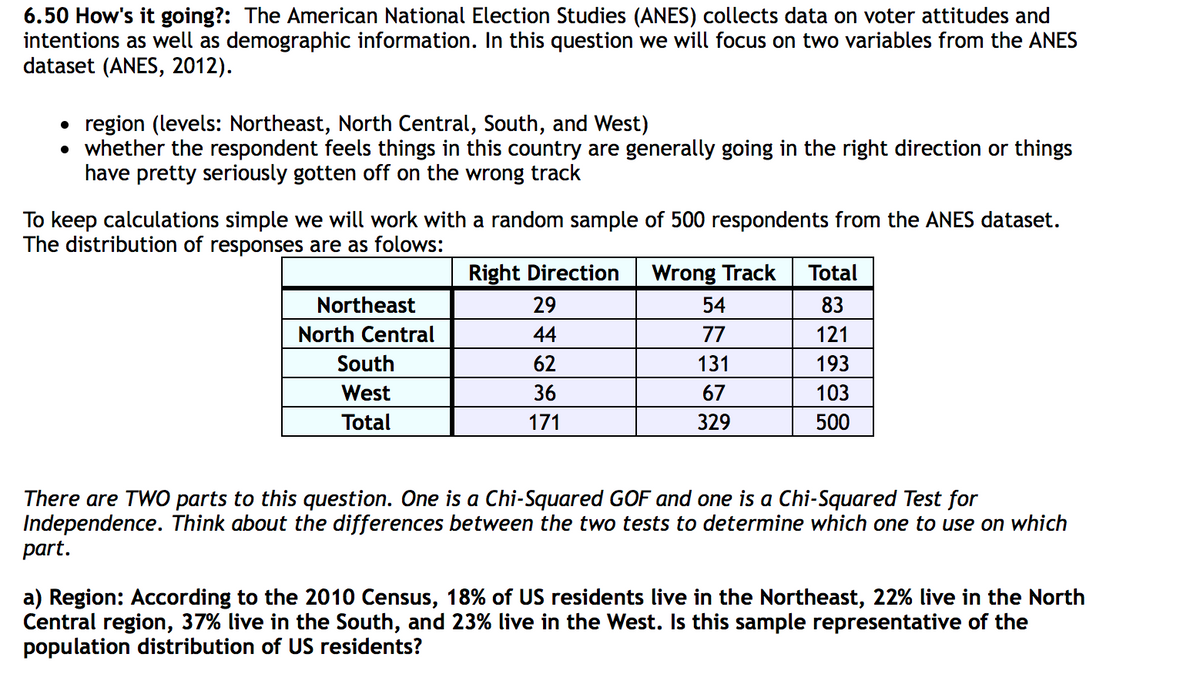
6.50 How's it going?: The American National Election Studies (ANES) collects data on voter attitudes and intentions as well as demographic information. In this question we will focus on two variables from the ANES dataset (ANES, 2012). • region (levels: Northeast, North Central, South, and West) • whether the respondent feels things in this country are generally going in the right direction or things have pretty seriously gotten off on the wrong track To keep calculations simple we will work with a random sample of 500 respondents from the ANES dataset. The distribution of responses are as folows: Right Direction Wrong Track Total Northeast 29 54 83 North Central 44 77 121 South 62 131 193 West 36 67 103 Total 171 329 500
6.50 How's it going?: The American National Election Studies (ANES) collects data on voter attitudes and intentions as well as demographic information. In this question we will focus on two variables from the ANES dataset (ANES, 2012). • region (levels: Northeast, North Central, South, and West) • whether the respondent feels things in this country are generally going in the right direction or things have pretty seriously gotten off on the wrong track To keep calculations simple we will work with a random sample of 500 respondents from the ANES dataset. The distribution of responses are as folows: Right Direction Wrong Track Total Northeast 29 54 83 North Central 44 77 121 South 62 131 193 West 36 67 103 Total 171 329 500

Glencoe Algebra 1, Student Edition, 9780079039897, 0079039898, 2018
18th Edition
ISBN:9780079039897
Author:Carter
Publisher:Carter
Chapter10: Statistics
Section: Chapter Questions
Problem 13PT

Related questions

Topic Video
Question
Transcribed Image Text:6.50 How's it going?: The American National Election Studies (ANES) collects data on voter attitudes and
intentions as well as demographic information. In this question we will focus on two variables from the ANES
dataset (ANES, 2012).
region (levels: Northeast, North Central, South, and West)
• whether the respondent feels things in this country are generally going in the right direction or things
have pretty seriously gotten off on the wrong track
To keep calculations simple we will work with a random sample of 500 respondents from the ANES dataset.
The distribution of responses are as folows:
Right Direction
Wrong Track
Total
Northeast
29
54
83
North Central
44
77
121
South
62
131
193
West
36
67
103
Total
171
329
500
There are TW0 parts to this question. One is a Chi-Squared GOF and one is a Chi-Squared Test for
Independence. Think about the differences between the two tests to determine which one to use on which
part.
a) Region: According to the 2010 Census, 18% of US residents live in the Northeast, 22% live in the North
Central region, 37% live in the South, and 23% live in the West. Is this sample representative of the
population distribution of US residents?
Expert Solution
This question has been solved!
Explore an expertly crafted, step-by-step solution for a thorough understanding of key concepts.

This is a popular solution!

Trending now
This is a popular solution!

Step by step
Solved in 2 steps with 7 images

Knowledge Booster


Learn more about
Need a deep-dive on the concept behind this application? Look no further. Learn more about this topic, statistics and related others by exploring similar questions and additional content below.Recommended textbooks for you
Glencoe Algebra 1, Student Edition, 9780079039897…
Algebra
ISBN:
9780079039897
Author:
Carter
Publisher:
McGraw Hill
Glencoe Algebra 1, Student Edition, 9780079039897…
Algebra
ISBN:
9780079039897
Author:
Carter
Publisher:
McGraw Hill