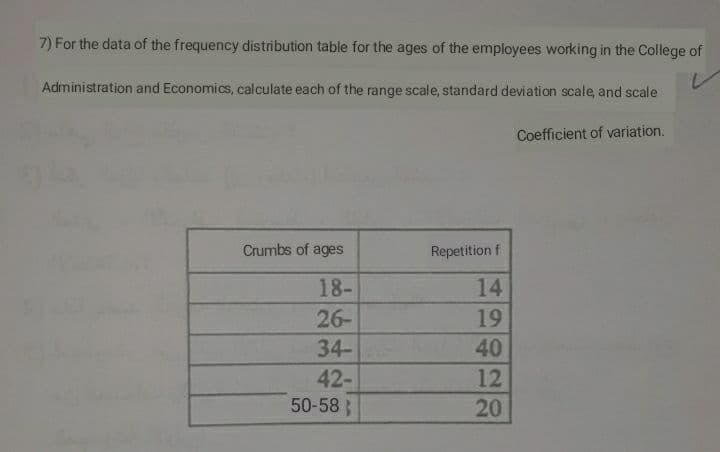
7) For the data of the frequency distribution table for the ages of the employees working in the College of Administration and Economics, calculate each of the range scale, standard deviation scale, and scale Coefficient of variation. Crumbs of ages Repetition f 18- 14 26- 19 34- 40 12 42- 50-58 ; 20


Q: Compute for the mean, the median, and the mode of each set of ungrouped data. Scores in English Test…
A: Scores Frequency 16-20 2 21-25 7 26-30 14 31-35 8 36-40 8 41-45 1
Q: 4. Find mean value of the given data. Scores Frequency (f) 41-45 36-40 8 31-35 26-30 14 21-25 16-20
A: Score and frequency are the given information, We have to form a table , Score Frequency (fi)…
Q: /For the below frequency distribution table calculate all the below reequipments. Class Frequency…
A: Since you have posted a question with multiple sub-parts, we will solve first three subparts for…
Q: The following data represent the difference in scores between the winning and losing teams in a…
A: Given : Point difference Number of Bowl games 1 - 5 4 6 - 10 4 11 - 15 9 16 - 20 4 21 -…
Q: The wage distribution of workers in certain factory is given below. Find the Coefficient of Mean…
A: Given wages in rupees number of workers 25 30 30 28 35 25 40 15 45 15 50 3
Q: 9. For which level of data is the mode used only as a measure of central tendency? O Interval O…
A: Since you have asked multiple question, we will solve the first question for you. If you want any…
Q: The scores from 50 psychology students that took a standardized test are summarized in the given…
A: The relative frequency of an individual class is defined as the ratio of the frequency of that class…
Q: The table below shows the frequency distribution for the ages of women who became mothers during one…
A: Solution : a. C b. Yes
Q: 3) Suppose the following indexed scores represent performance on a new survey meant to understand an…
A:
Q: 3 13 Calculate the mean deviation (from median) from the following data :- Class interval Frequency…
A:
Q: Suppose that the FDT of heights (in cm) of students is given in the table. Classes Frequency…
A: We have given that, The data set is, Classes frequency 147-155 10 156-164 2 165-173 3…
Q: 2. The frequency distribution for the systolic blood pressure readings (mmHg) of 200 randomly…
A:
Q: 13. Calculate the mean of the data set represent via the distribution below. Class Midpoints…
A:
Q: Find mean, median and mode of the following grouped data:…
A:
Q: Past records suggest that the mean annual income, μ1 , of teachers in state of California is less…
A: State the hypotheses. That is, there is no sufficient evidence to reject the claim that the mean…
Q: Construct the cumulative frequency distribution for the given data. Age (years) of Best Actress…
A: Given Age (years) of Best Actress when award was won Frequency 20-29 29 30-39…
Q: - 6-6. Calculate mean deviation from median of the following distribution. Class Interval 50 100 100…
A:
Q: -32. Calculate Coefficient of Concurrent Deviations from the data given below : No. of Workers: 300…
A:
Q: Give an example of a data set of size 10 with median of 8, exactly one outlier, and in which "7" has…
A: An example of a data set of size 10 with median of 8, exactly one outlier, and in which "7" has a…
Q: Find the range and standard deviation of the set of data. 6, 9, 6, 9, 9, 11, 13 O
A: Given - The set of data : 6, 9, 6, 9, 9, 11, 13 To find - Find the range and standard deviation of…
Q: 4. The following data are the temperatures (in °C) of effluent at discharge from a sewage treatment…
A:
Q: The durations (minutes) of 26 electric power outages in the community of Somando Heights over the…
A: (A) Sample size = n = 26. mean=∑xn=34+...+2026=33.19 Arrange the data in ascending order.…
Q: (b) Distinguish between the measures of central tendency and measures of dispersion.
A: Measures that indicates the approximate center of a distribution are called measures of central…
Q: 7. Find the mean and standard devjation of the set of data. Round answers to two decimal places. 16,…
A:
Q: he following data represent the number of people aged 25 to 64 years covered by health insurance…
A:
Q: ****For the following data Size range (um) Frequency 20-39 2 40-59 32 60-79 64 80-99 48 100-119 30…
A: Given: Frequency distribution for Size range.The first column contains the intervals for size ranges…
Q: The following data represent the number of people aged 25 to 64 years covered by health insurance…
A: Solution-: We prepare the following table: Class Class Boundaries LB UB Mid Point (xi) Number…
Q: Here is a frequency distribution for a small data set: data freq 36 37 38 3. 39 3. 40 Find the…
A:
Q: The following table summarizes the grade point averages (GPAs) of graduate students in a statistics…
A:
Q: 1.) The number of unhealthy days in selected cities are given below. Construct a Frequency…
A: For the given data, we need to construct a frequency distribution table with classes of "7" and a…
Q: In general, % of the values in a data set lie at or below the median. ___________% of the…
A: QUARTILE: The lower quartile is the middle number of half of the data below the median , and the…
Q: 2.3 Compute the Mean deviation from mean and Mean deviation from mode for the following frequency…
A: Concentration of all the values around the central value of the given data is known as measures of…
Q: 36. Find the mean for the following frequency tables. a. Grade Frequency 49.5–59.5 2 59.5–69.5 3…
A: Since you have posted multiple questions, as per our guidelines we have provided answer for first…
Q: Calculate the coefficient of concurrent deviations for the following data
A: Let X denote the Supply and Y denote the Demand. We have to calculate the coefficient of concurrent…
Q: 4. Find mean value of the given data. Scores Frequency (f) 41-45 1 36-40 31-35 26-30 14 21-25 16-20
A: The table helps to find the mean value. Scores Frequency mid point fx 41-45 1 43 43 36-40 8…
Q: C. An agricultural researcher wants to compare the mean numbers of pods between three plot types…
A: Null hypothesis: H0:µ1 = µ2 = µ3 Alternative hypothesis: H0: Not all the population means are equal.…
Q: Given the following observation, 1.7, 2.2, 3.9, 2.11 and 14.7. Find the mean, median and the…
A: Hi, thanks for the question. Since there are multiple questions posted in the question, we will…
Q: The hourly rates of a sample of 70 contractual workers from different manufacturing company are…
A: Disclaimer, “Since you have posted a question with multiple sub-parts, we will solve first three…
Q: The yearly incomes received by 30 randomly selected Quantitative Students in some selected areas in…
A: Since you have posted question with multiple subparts, I can solve only first three subparts for…
Q: Calculate the mean deviation and its coefficient both from mean and median for the following. Marks:…
A:
Q: 2.3 Measures of the Center of the Data 36. Find the mean for the following frequency tables. a.…
A:
Q: Calculate the mean and median from the following table : Class Intervals Frequency 6.5- 7.5 5…
A: Given data is Class Frequency 6.2 - 7.5 5 7.5 - 8.5 12 8.5 - 9.5 25 9.5 - 10.5 48 10.5…
Q: Why does the graph on the right have a higher standard deviation? 1 2 3 4 5 6 7 1 2 3 4 5 6 7 What…
A: We'll answer the first question since the exact one wasn't specified. Please submit a new question.…
Q: 1. Find the measures of central tendency of frequency and standard deviation of the distribution…
A: Calculate Mean, Median, Mode, Population Standard deviation (σ), Sample Standard deviation (S) from…
Q: The following is a frequency distribution of an entrance examination. Class interval…
A: Solution 1) mean
Q: For items 28-30, consider the following frequency distribution: Frequency Class Interval 1. 21-26…
A: 28) Use the given data to form the excel table: Midpoint (x) Frequency x*F(x) C.F 21 to…
Q: Past records suggest that the mean annual income, μ1 , of teachers in state of Utah is greater…
A: The sample means of annual income of teachers in Utah and in Oregon are, The null hypothesis is,…
Q: • Compute for the range, the mean deviation, and the standard of each set of grouped data. Scores of…
A: Given that
Q: Compute each of the single-variable statistics discussed in class for the data below: 84.7 58.2…
A: Arrange the given data in ascending order44.3, 58.2, 58.2, 68.3, 84.1, 84.7, 89.1, 89.7, 91.9,…
Q: Would the data sets that follow possess relative frequency distributions that are symmetric, skewed…
A: Introduction:In a large company, there will be all sorts of employees- employees in a very high…


Trending now
This is a popular solution!

Step by step
Solved in 2 steps with 9 images

- Suppose that household income in a state is distributed Normally with mean $60,000/year and standard deviation $10,000. What percentage of households have an income greater than $100,000?Supposed a number of students are added to an original group of students where all of whose ages are equal to the mean of age of original group. The standard deviation will?Mensa is an international high IQ society that accepts into its membership only those who score within the top 2% of the population on an approved intelligence test. Suppose that the scores on a Mensa-approved test are normally distributed with a population mean of 240 and standard deviation of 30. What is the minimum score on this test that would qualify one for Mensa membership?
- At a certain excavation site, archaeological studies have used the method of tree-ring dating in an effort to determine when people lived in there. Wood from several excavations gave a mean of (year) 1305 with a standard deviation of 22 years. The distribution of dates was more or less mound-shaped and symmetrical about the mean. Use the empirical rule to estimate a range of years centered about the mean in which about 68.3% of the data (tree-ring dates) will be found. Group of answer choices from 1239 to 1283 from 1305 to 1349 from 1239 to 1327 from 1327 to 1371 from 1283 to 1327Suppose the systolic blood pressure (in mm) of adult males has an approximately normal distribution with mean μ =125 and standard deviation σ =14. Create an empirical rule graph with the following: A title and label for the horizontal axis including units. Vertical lines for the mean and first 3 standard deviations in each direction with numerical labels on the horizontal axis Labels for the areas of the 8 regions separated by the vertical lines as well.Suppose the systolic blood pressure (in mm) of adult males has an approximately normal distribution with mean μμ =125 and standard deviation σσ =14. Create an empirical rule graph with the following: A title and label for the horizontal axis including units. Vertical lines for the mean and first 3 standard deviations in each direction with numerical labels on the horizontal axis Labels for the areas of the 8 regions separated by the vertical lines as well.
- Suppose that the blood pressure of the human inhabitants of a certain Pacific island is distributed with mean, μ = 90 mmHg and standard deviation , σ = 8 mmHg. According to Chebyshev's Theorem, at least what percentage of the islander's have blood pressure in the range from 74 mmHg to 106 mmHg ?Suppose that in a certain region of the country the mean duration of first marriages that end in divorce is 7.8 years, standard deviation 1.2 years. Suppose a sample of 75 divorces were consideredSuppose the prevalence of type II diabetes in a community is 36%. Researchers want to sample 16 individuals from the community for a new public health study. Let ? denote the number of individuals with type II diabetes among the 16 selected individuals. Find the mean and standard deviation of ?
- Among n=15 randomly selected participants of a hypothetical study, cholesterol was measured at Exam 1 and Exam 2. The mean difference in cholesterol between the two exams was -15.5 units and the standard deviation was 22.8 units. Differences were computed by subtracting the Exam 1 from Exam 2 value. Is there a statistically significant difference in mean cholesterol measured at Exam 1 and Exam 2 of the study?The sociologist finds that for a certain population, the mean number of years of educations is 13.2 years witha standard deviation of 3.04 years. From a certain region, a random sample of 62 people is drawn from thispopulation and recorded a sample mean of 13.96 years. Test the claim that the mean number of years ofeducation is the same from the population with 0.05 level of significance.Suppose a normally distributed set of data has a mean of 167 and a standard deviation of 19. Use the 68-95-99.7 rule (sometimes called the Empirical rule or the Standard Deviation rule) to determine the percentage of scores in the data set expected to be between the scores 129 and 224. Answer =