7. | Interpretation You are manager of a specialty coffee shop and collect data throughout a full day regarding waiting time for customers from the time they enter the shop until the time they pick up their order. (a) What type of distribution do you think would be most desirable for the wait- ing times: skewed right, skewed left, mound-shaped symmetric? Explain. (b) What if the distribution for waiting times were bimodal? What might be some explanations?
7. | Interpretation You are manager of a specialty coffee shop and collect data throughout a full day regarding waiting time for customers from the time they enter the shop until the time they pick up their order. (a) What type of distribution do you think would be most desirable for the wait- ing times: skewed right, skewed left, mound-shaped symmetric? Explain. (b) What if the distribution for waiting times were bimodal? What might be some explanations?

Glencoe Algebra 1, Student Edition, 9780079039897, 0079039898, 2018
18th Edition
ISBN:9780079039897
Author:Carter
Publisher:Carter
Chapter10: Statistics
Section: Chapter Questions
Problem 27SGR

Related questions
Question
Only answer number 7. Show work! Thanks.
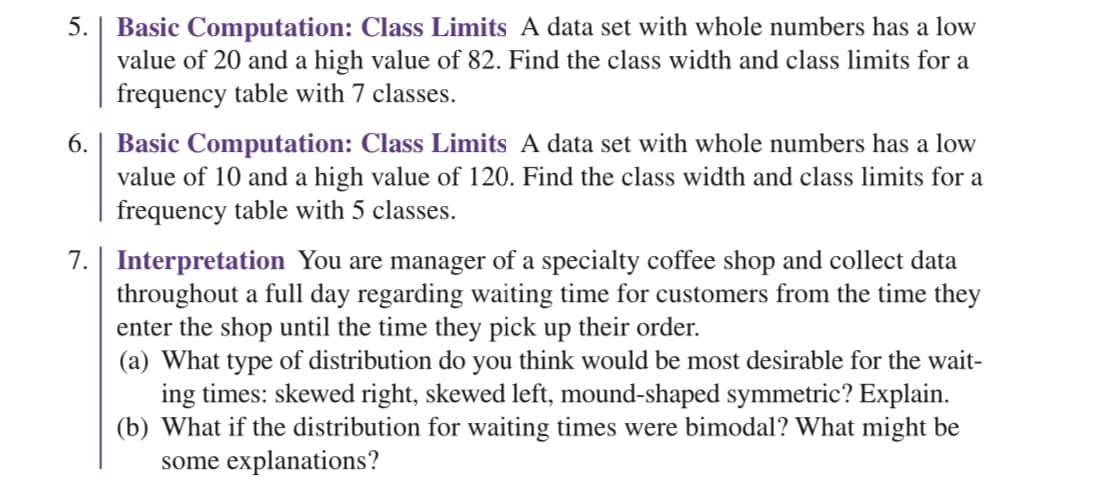
Transcribed Image Text:5. | Basic Computation: Class Limits A data set with whole numbers has a low
value of 20 and a high value of 82. Find the class width and class limits for a
frequency table with 7 classes.
6. | Basic Computation: Class Limits A data set with whole numbers has a low
value of 10 and a high value of 120. Find the class width and class limits for a
frequency table with 5 classes.
7. Interpretation You are manager of a specialty coffee shop and collect data
throughout a full day regarding waiting time for customers from the time they
enter the shop until the time they pick up their order.
(a) What type of distribution do you think would be most desirable for the wait-
ing times: skewed right, skewed left, mound-shaped symmetric? Explain.
(b) What if the distribution for waiting times were bimodal? What might be
some explanations?
Expert Solution
This question has been solved!
Explore an expertly crafted, step-by-step solution for a thorough understanding of key concepts.

This is a popular solution!

Trending now
This is a popular solution!

Step by step
Solved in 3 steps

Recommended textbooks for you
Glencoe Algebra 1, Student Edition, 9780079039897…
Algebra
ISBN:
9780079039897
Author:
Carter
Publisher:
McGraw Hill
Glencoe Algebra 1, Student Edition, 9780079039897…
Algebra
ISBN:
9780079039897
Author:
Carter
Publisher:
McGraw Hill