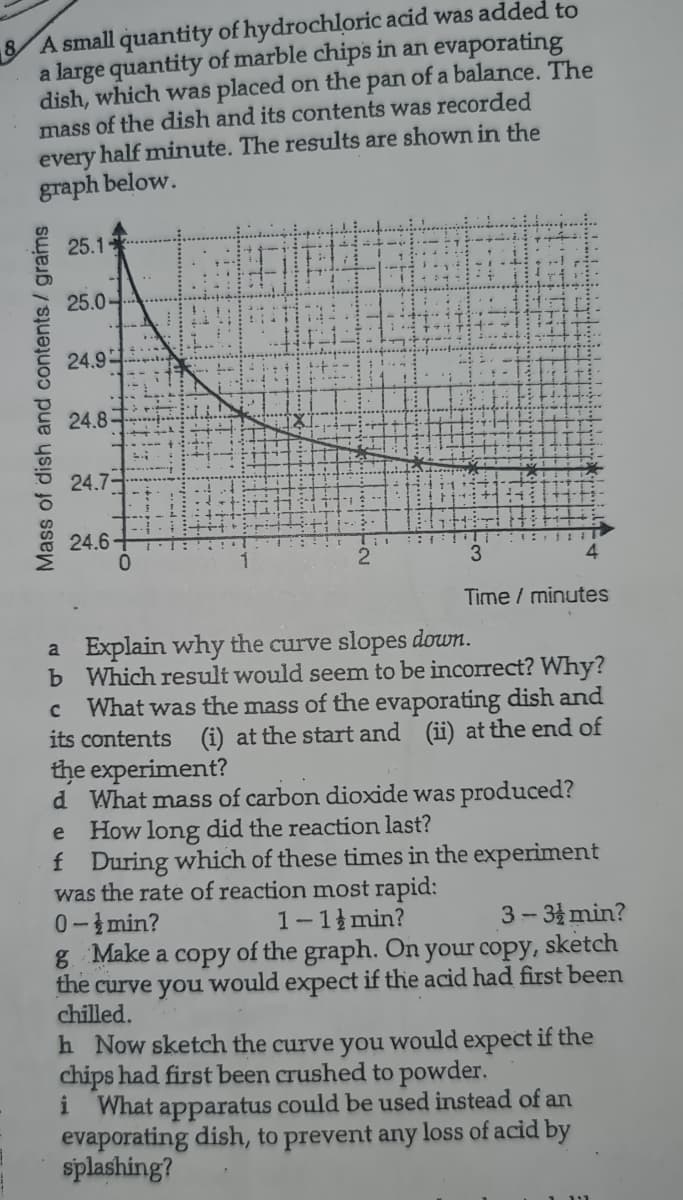
8 A small quantity of hydrochloric acid was added to a large quantity of marble chips in an evaporating dish, which was placed on the pan of a balance. The mass of the dish and its contents was recorded every half minute. The results are shown in the graph below. 25.1 25.0 24.9 24.8 24.7- 24.6+ 0. 1 3 4 Time / minutes a Explain why the curve slopes down. b Which result would seem to be incorect? Why? What was the mass of the evaporating dish and its contents (i) at the start and (ii) at the end of the experiment? Mass of dish and contents/ grams
8 A small quantity of hydrochloric acid was added to a large quantity of marble chips in an evaporating dish, which was placed on the pan of a balance. The mass of the dish and its contents was recorded every half minute. The results are shown in the graph below. 25.1 25.0 24.9 24.8 24.7- 24.6+ 0. 1 3 4 Time / minutes a Explain why the curve slopes down. b Which result would seem to be incorect? Why? What was the mass of the evaporating dish and its contents (i) at the start and (ii) at the end of the experiment? Mass of dish and contents/ grams

Chapter7: Statistical Data Treatment And Evaluation
Section: Chapter Questions
Problem 7.16QAP

Related questions

Question
Transcribed Image Text:8 A small quantity of hydrochloric acid was added to
a large quantity of marble chips in an evaporating
dish, which was placed on the pan of a balance. The
mass of the dish and its contents was recorded
half minute. The results are shown in the
every
graph below.
25.1
25.0
24.9
24.8-
24.7-
24.6+
0.
:::
3.
4.
Time / minutes
a Explain why the curve slopes down.
b Which result would seem to be incorrect? Why?
What was the mass of the evaporating dish and
its contents (i) at the start and (ii) at the end of
the experiment?
d What mass of carbon dioxide was produced?
e How long did the reaction last?
f During which of these times in the experiment
was the rate of reaction most rapid:
0-min?
g Make a copy of the graph. On your copy, sketch
the
1-1 min?
3- 3 min?
curve you
chilled.
would expect if the acid had first been
h Now sketch the curve you would expect if the
chips had first been crushed to powder.
i
What apparatus could be used instead of an
evaporating dish, to prevent any loss of acid by
splashing?
Mass of dish and contents/ grams
Expert Solution
This question has been solved!
Explore an expertly crafted, step-by-step solution for a thorough understanding of key concepts.

Step by step
Solved in 2 steps

Knowledge Booster


Learn more about
Need a deep-dive on the concept behind this application? Look no further. Learn more about this topic, chemistry and related others by exploring similar questions and additional content below.Recommended textbooks for you

Principles of Modern Chemistry
Chemistry
ISBN:
9781305079113
Author:
David W. Oxtoby, H. Pat Gillis, Laurie J. Butler
Publisher:
Cengage Learning
Principles of Modern Chemistry
Chemistry
ISBN:
9781305079113
Author:
David W. Oxtoby, H. Pat Gillis, Laurie J. Butler
Publisher:
Cengage Learning