
Chapter17: Capital And Time
Section: Chapter Questions
Problem 17.4P

Related questions
Question
100%
I need help solving 8.1.2
Transcribed Image Text:the
141
8.2 THE SECOND DERIVATIVE
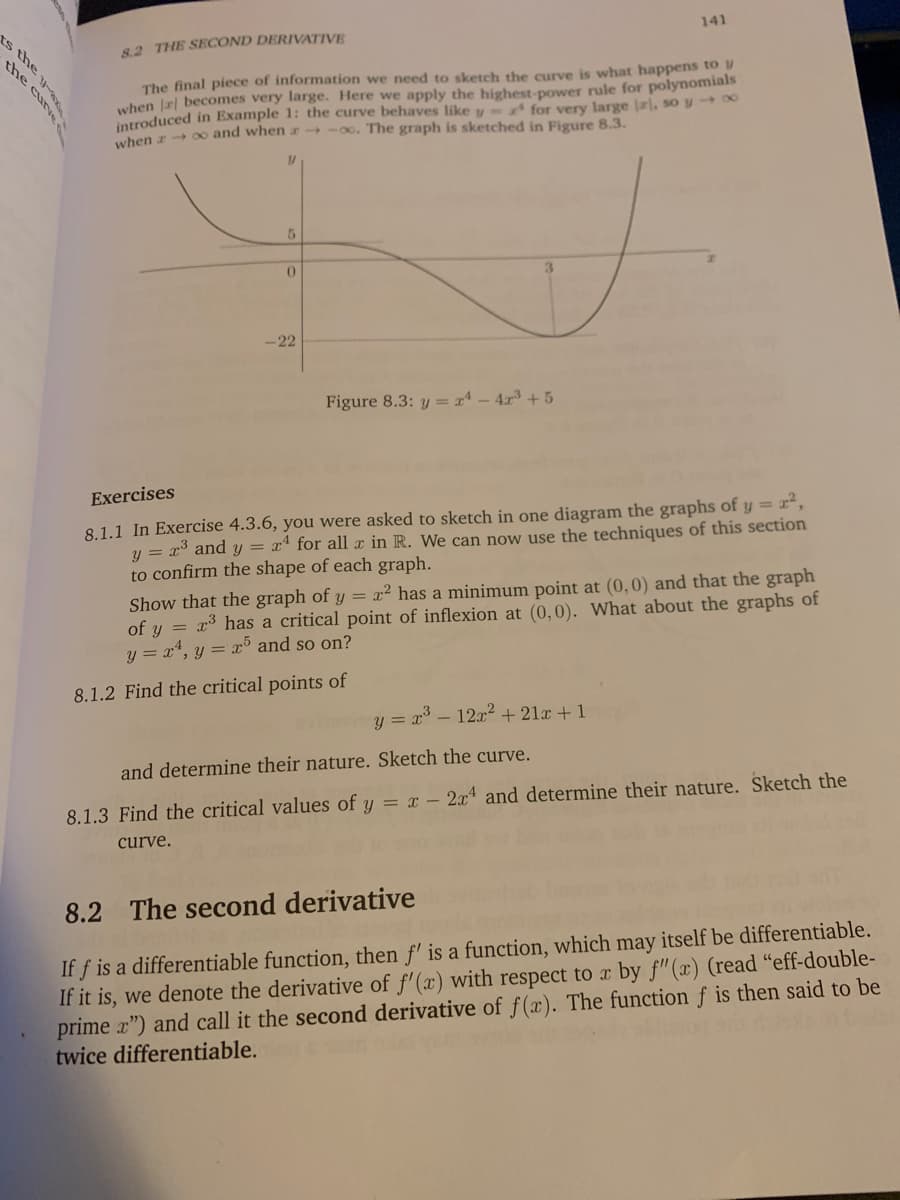
The final piece of information we need to sketch the curve is what happens to
when r| becomes very large. Here we apply the highest-power rule for polynomials
introduced in Example 1: the curve behaves like y= for very large ), so y 8
when r+ 00 and when a →-00. The graph is sketched in Figure 8.3.
-22
Figure 8.3: y = x* – 4x³ + 5
Exercises
8.1.1 In Exercise 4.3.6, you were asked to sketch in one diagram the graphs of y = r²,
y = x and y = x* for all x in R. We can now use the techniques of this section
to confirm the shape of each graph.
Show that the graph of y = x² has a minimum point at (0,0) and that the graph
of y = x³ has a critical point of inflexion at (0,0). What about the graphs of
y = x, y = x and so on?
8.1.2 Find the critical points of
y = x – 12x² + 21x + 1
and determine their nature. Sketch the curve.
8.1.3 Find the critical values of y = x – 2x and determine their nature. Sketch the
curve.
8.2 The second derivative
If f is a differentiable function, then f' is a function, which may itself be differentiable.
If it is, we denote the derivative of f'(x) with respect to x by f"(x) (read "eff-double-
prime x") and call it the second derivative of f (x). The function f is then said to be
twice differentiable.
Is the y
Expert Solution
This question has been solved!
Explore an expertly crafted, step-by-step solution for a thorough understanding of key concepts.

Step by step
Solved in 2 steps with 3 images

Knowledge Booster


Learn more about
Need a deep-dive on the concept behind this application? Look no further. Learn more about this topic, economics and related others by exploring similar questions and additional content below.Recommended textbooks for you