87. Revenue. (A) Using the price-demand function p(x) = 75 - 3x 1 ≤ x ≤ 20 from Problem 85, write the company's revenue function and indicate its domain. (B) Complete Table 10, computing revenues to the nearest million dollars. Table 10 Revenue x (millions) 1 48262 12 16 20 R(x) (million $) 72 (C) Plot the points from part (B) and sketch a graph of the revenue function using these points. Choose millions for the units on the horizontal and vertical axes.
87. Revenue. (A) Using the price-demand function p(x) = 75 - 3x 1 ≤ x ≤ 20 from Problem 85, write the company's revenue function and indicate its domain. (B) Complete Table 10, computing revenues to the nearest million dollars. Table 10 Revenue x (millions) 1 48262 12 16 20 R(x) (million $) 72 (C) Plot the points from part (B) and sketch a graph of the revenue function using these points. Choose millions for the units on the horizontal and vertical axes.

Chapter7: Production And Cost In The Firm
Section: Chapter Questions
Problem 1.3P

Related questions
Question
I need question 87 answered and I provided the previous information needed from question 85
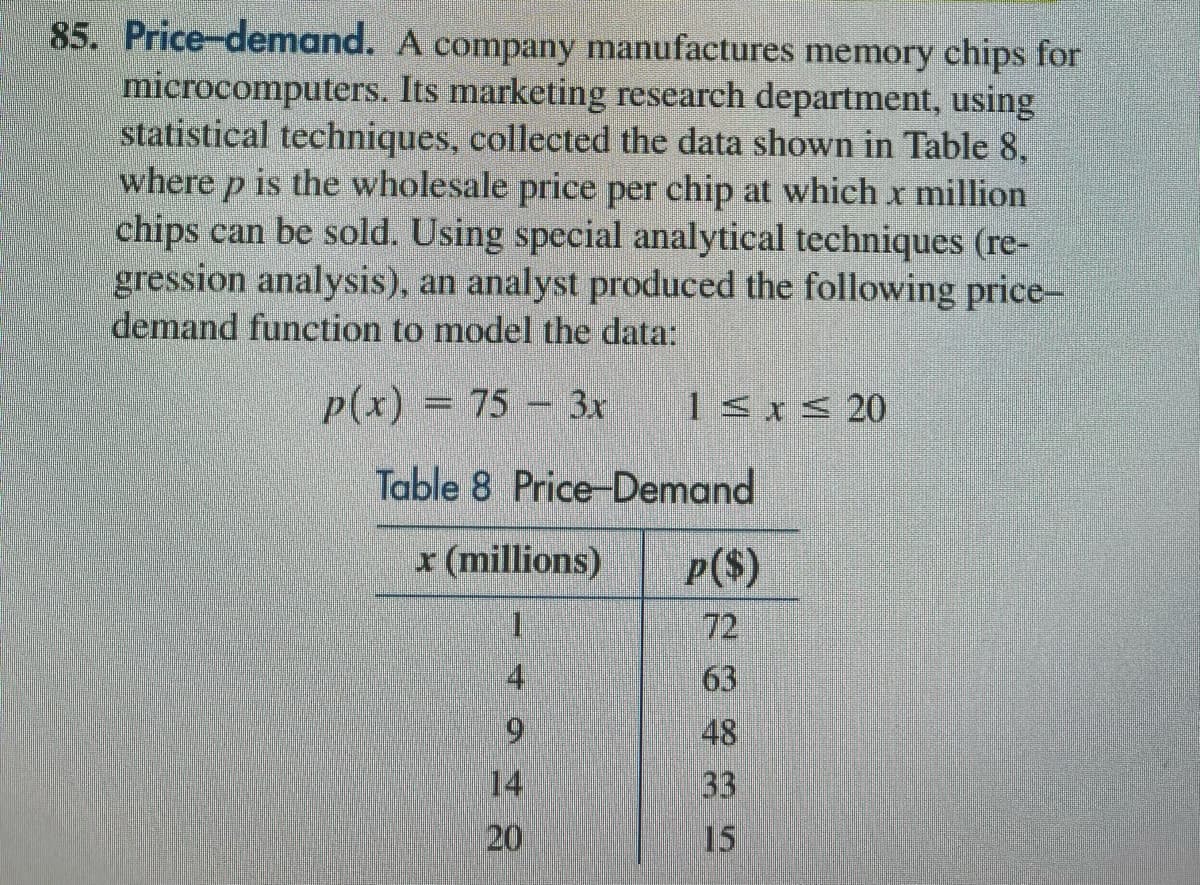
Transcribed Image Text:85. Price-demand. A company manufactures memory chips for
microcomputers. Its marketing research department, using
statistical techniques, collected the data shown in Table 8,
where p is the wholesale price per chip at which x million
chips can be sold. Using special analytical techniques (re-
gression analysis), an analyst produced the following price-
demand function to model the data:
p(x) = 75 - 3x
1≤x≤ 20
Table 8 Price-Demand
x (millions)
I
4
9
14
20
p($)
72
63
48
33
15
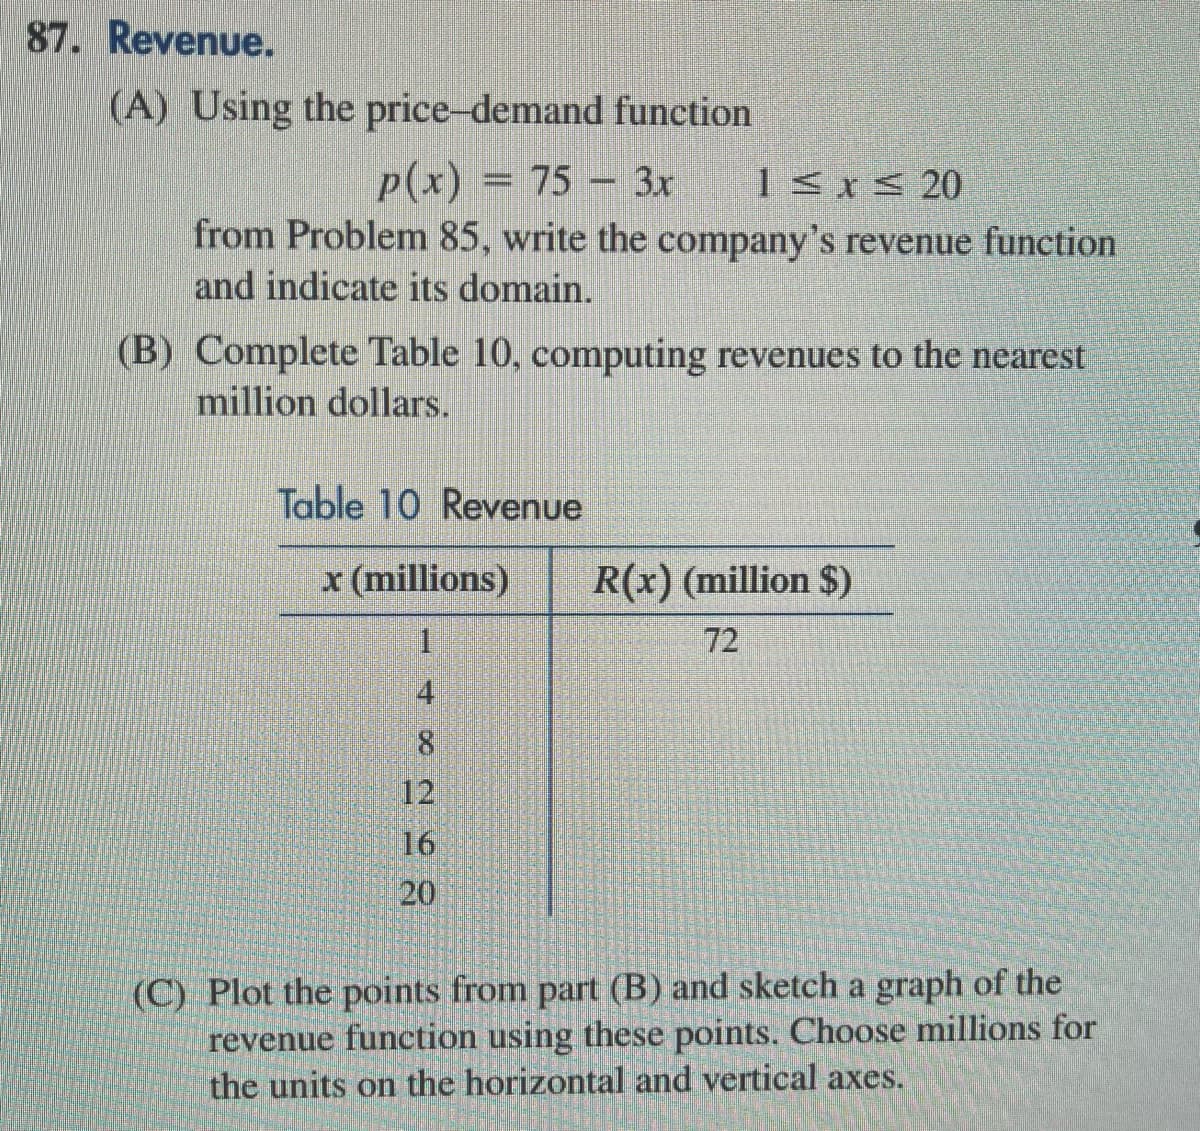
Transcribed Image Text:87. Revenue.
(A) Using the price-demand function
p(x) = 75 - 3x 1≤x≤ 20
from Problem 85, write the company's revenue function
and indicate its domain.
(B) Complete Table 10, computing revenues to the nearest
million dollars.
Table 10 Revenue
x (millions)
1
4
∞
12
16
20
R(x) (million $)
72
(C) Plot the points from part (B) and sketch a graph of the
revenue function using these points. Choose millions for
the units on the horizontal and vertical axes.
Expert Solution
This question has been solved!
Explore an expertly crafted, step-by-step solution for a thorough understanding of key concepts.

This is a popular solution!

Trending now
This is a popular solution!

Step by step
Solved in 3 steps with 1 images

Knowledge Booster


Learn more about
Need a deep-dive on the concept behind this application? Look no further. Learn more about this topic, economics and related others by exploring similar questions and additional content below.Recommended textbooks for you

Economics: Private and Public Choice (MindTap Cou…
Economics
ISBN:
9781305506725
Author:
James D. Gwartney, Richard L. Stroup, Russell S. Sobel, David A. Macpherson
Publisher:
Cengage Learning

Microeconomics: Private and Public Choice (MindTa…
Economics
ISBN:
9781305506893
Author:
James D. Gwartney, Richard L. Stroup, Russell S. Sobel, David A. Macpherson
Publisher:
Cengage Learning
Economics: Private and Public Choice (MindTap Cou…
Economics
ISBN:
9781305506725
Author:
James D. Gwartney, Richard L. Stroup, Russell S. Sobel, David A. Macpherson
Publisher:
Cengage Learning
Microeconomics: Private and Public Choice (MindTa…
Economics
ISBN:
9781305506893
Author:
James D. Gwartney, Richard L. Stroup, Russell S. Sobel, David A. Macpherson
Publisher:
Cengage Learning