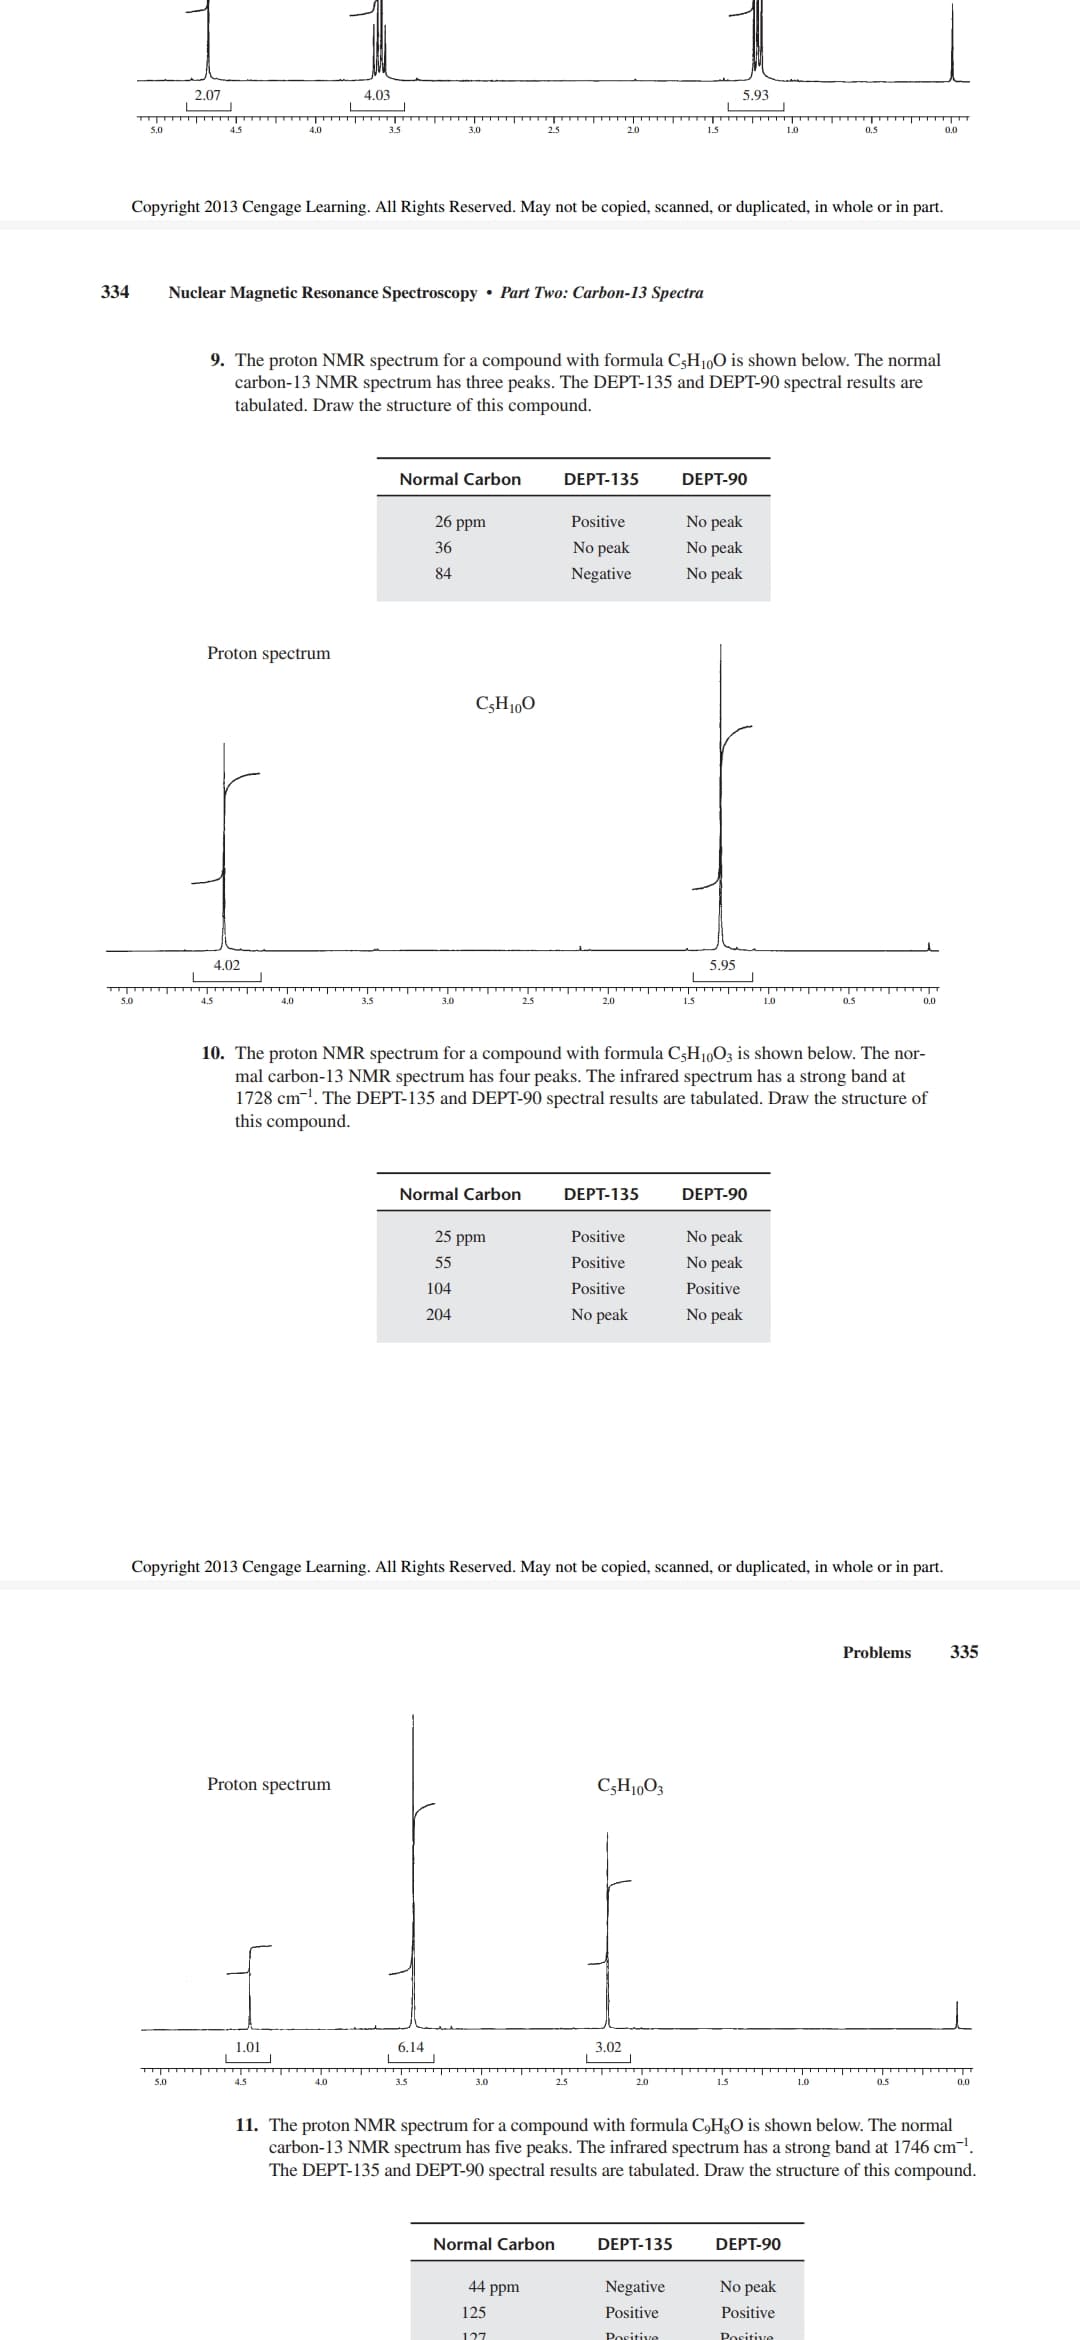
9. The proton NMR spectrum for a compound with formula C3H1,0 is shown below. The normal carbon-13 NMR spectrum has three peaks. The DEPT-135 and DEPT-90 spectral results are tabulated. Draw the structure of this compound. Normal Carbon DEPT-135 DEPT-90 26 ppm No peak No peak No peak Positive 36 No peak 84 Negative

Organic Chemistry
8th Edition
ISBN:9781305580350
Author:William H. Brown, Brent L. Iverson, Eric Anslyn, Christopher S. Foote
Publisher:William H. Brown, Brent L. Iverson, Eric Anslyn, Christopher S. Foote
Chapter20: Dienes, Conjugated Systems, And Pericyclic Reactions
Section20.3: Uv-visible Spectroscopy
Problem 20.5P
icon
Related questions
icon
Concept explainers
Question

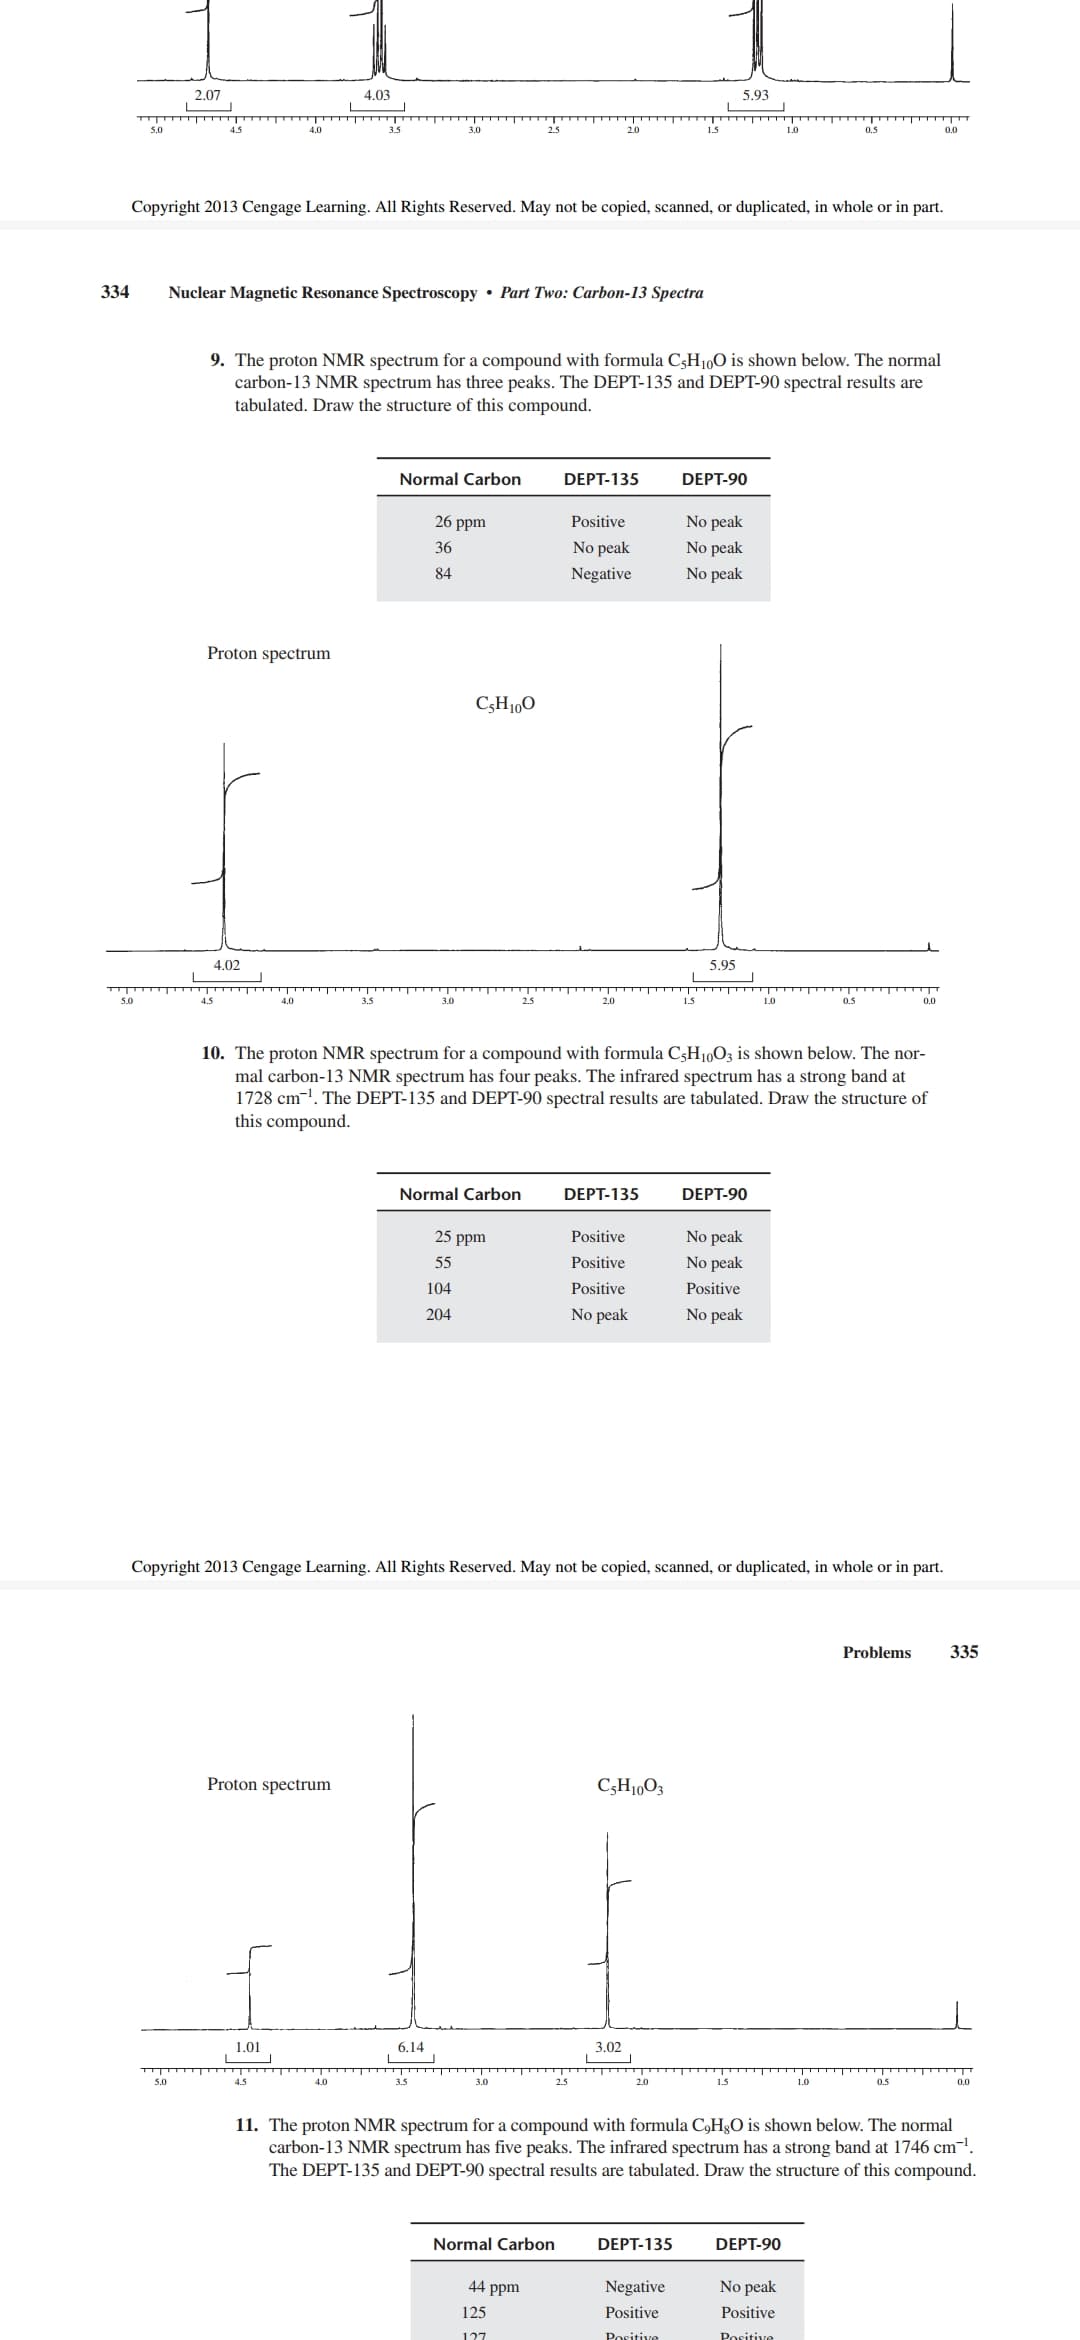
Pavia book fifth edition ques no9 page 334
2.07
4.03
5.93
2.0
0.5
0.0
Copyright 2013 Cengage Learning. All Rights Reserved. May not be copied, scanned, or duplicated, in whole or in part.
334
Nuclear Magnetic Resonance Spectroscopy • Part Two: Carbon-13 Spectra
9. The proton NMR spectrum for a compound with formula C3H10O is shown below. The normal
carbon-13 NMR spectrum has three peaks. The DEPT-135 and DEPT-90 spectral results are
tabulated. Draw the structure of this compound.
Normal Carbon
DEPT-135
DEPT-90
No peak
No peak
26 ppm
Positive
36
No peak
84
Negative
No peak
Proton spectrum
C3H1,0
4.02
5.95
50
2.5
2.0
1.5
1.0
0.5
10. The proton NMR spectrum for a compound with formula C3H10O3 is shown below. The nor-
mal carbon-13 NMR spectrum has four peaks. The infrared spectrum has a strong band at
1728 cm-1. The DEPT-135 and DEPT-90 spectral results are tabulated. Draw the structure of
this compound.
Normal Carbon
DEPT-135
DEPT-90
25 ppm
Positive
No peak
55
Positive
No peak
104
Positive
Positive
204
No peak
No peak
Copyright 2013 Cengage Learning. All Rights Reserved. May not be copied, scanned, or duplicated, in whole or in part.
Problems
335
Proton spectrum
C;H1,O3
1.01
6.14
3.02
3.0
2.5
2.0
1.5
1.0
0.5
0.0
11. The proton NMR spectrum for a compound with formula C,HgO is shown below. The normal
carbon-13 NMR spectrum has five peaks. The infrared spectrum has a strong band at 1746 cm-!.
The DEPT-135 and DEPT-90 spectral results are tabulated. Draw the structure of this compound.
Normal Carbon
DEPT-135
DEPT-90
44 ppm
Negative
No peak
125
Positive
Positive
127
Positive
Positive
Transcribed Image Text:2.07 4.03 5.93 2.0 0.5 0.0 Copyright 2013 Cengage Learning. All Rights Reserved. May not be copied, scanned, or duplicated, in whole or in part. 334 Nuclear Magnetic Resonance Spectroscopy • Part Two: Carbon-13 Spectra 9. The proton NMR spectrum for a compound with formula C3H10O is shown below. The normal carbon-13 NMR spectrum has three peaks. The DEPT-135 and DEPT-90 spectral results are tabulated. Draw the structure of this compound. Normal Carbon DEPT-135 DEPT-90 No peak No peak 26 ppm Positive 36 No peak 84 Negative No peak Proton spectrum C3H1,0 4.02 5.95 50 2.5 2.0 1.5 1.0 0.5 10. The proton NMR spectrum for a compound with formula C3H10O3 is shown below. The nor- mal carbon-13 NMR spectrum has four peaks. The infrared spectrum has a strong band at 1728 cm-1. The DEPT-135 and DEPT-90 spectral results are tabulated. Draw the structure of this compound. Normal Carbon DEPT-135 DEPT-90 25 ppm Positive No peak 55 Positive No peak 104 Positive Positive 204 No peak No peak Copyright 2013 Cengage Learning. All Rights Reserved. May not be copied, scanned, or duplicated, in whole or in part. Problems 335 Proton spectrum C;H1,O3 1.01 6.14 3.02 3.0 2.5 2.0 1.5 1.0 0.5 0.0 11. The proton NMR spectrum for a compound with formula C,HgO is shown below. The normal carbon-13 NMR spectrum has five peaks. The infrared spectrum has a strong band at 1746 cm-!. The DEPT-135 and DEPT-90 spectral results are tabulated. Draw the structure of this compound. Normal Carbon DEPT-135 DEPT-90 44 ppm Negative No peak 125 Positive Positive 127 Positive Positive
Expert Solution
trending now

Trending now

This is a popular solution!

steps

Step by step

Solved in 5 steps with 3 images

Blurred answer
Knowledge Booster
Ideal and Real Gases
Learn more about
Need a deep-dive on the concept behind this application? Look no further. Learn more about this topic, chemistry and related others by exploring similar questions and additional content below.
Similar questions
  • SEE MORE QUESTIONS
Recommended textbooks for you
Organic Chemistry
Organic Chemistry
Chemistry
ISBN:
9781305580350
Author:
William H. Brown, Brent L. Iverson, Eric Anslyn, Christopher S. Foote
Publisher:
Cengage Learning
Organic Chemistry: A Guided Inquiry
Chemistry
ISBN:
9780618974122
Author:
Andrei Straumanis
Publisher:
Cengage Learning
Physical Chemistry
Physical Chemistry
Chemistry
ISBN:
9781133958437
Author:
Ball, David W. (david Warren), BAER, Tomas
Publisher:
Wadsworth Cengage Learning,