(a) Assuming that a simple linear regression model is appropriate, estimate the regression model relating BOD (y) to the time (x). Round your final answers to 4 decimal places. ŷ = i + i What is the estimate of a??
(a) Assuming that a simple linear regression model is appropriate, estimate the regression model relating BOD (y) to the time (x). Round your final answers to 4 decimal places. ŷ = i + i What is the estimate of a??

Linear Algebra: A Modern Introduction
4th Edition
ISBN:9781285463247
Author:David Poole
Publisher:David Poole
Chapter7: Distance And Approximation
Section7.3: Least Squares Approximation
Problem 31EQ

Related questions
Question
100%
TOPIC: Linear Regression
please answer, will upvote your solutions.
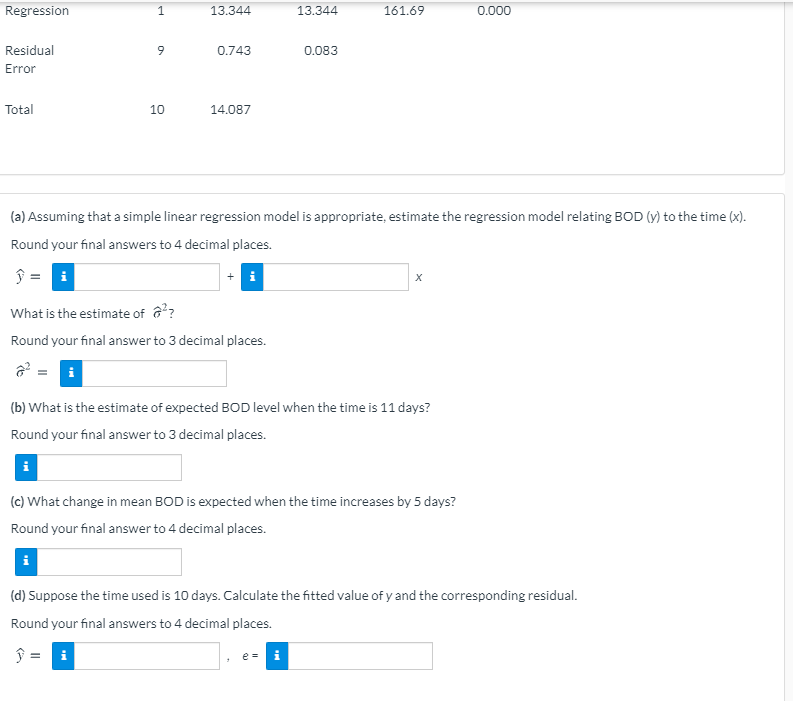
Transcribed Image Text:Regression
13.344
13.344
161.69
0.000
Residual
9.
0.743
0.083
Error
Total
10
14.087
(a) Assuming that a simple linear regression model is appropriate, estimate the regression model relating BOD (y) to the time (x).
Round your final answers to 4 decimal places.
ŷ = i
+ i
What is the estimate of a??
Round your final answer to 3 decimal places.
(b) What is the estimate of expected BOD level when the time is 11 days?
Round your final answer to 3 decimal places.
(c) What change in mean BOD is expected when the time increases by 5 days?
Round your final answer to 4 decimal places.
i
(d) Suppose the time used is 10 days. Calculate the fitted value of y and the corresponding residual.
Round your final answers to 4 decimal places.
e =
i
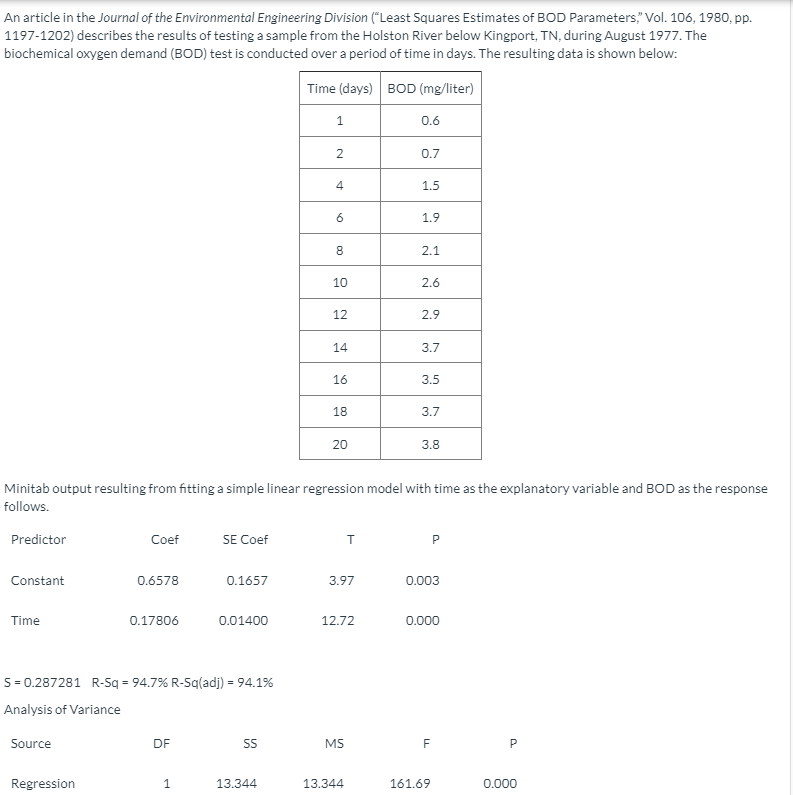
Transcribed Image Text:An article in the Journal of the Environmental Engineering Division ("Least Squares Estimates of BOD Parameters," Vol. 106, 1980, pp.
1197-1202) describes the results of testing a sample from the Holston River below Kingport, TN, during August 1977. The
biochemical oxygen demand (BOD) test is conducted over a period of time in days. The resulting data is shown below:
Time (days) BOD (mg/liter)
1
0.6
0.7
1.5
1.9
2.1
10
2.6
12
2.9
14
3.7
16
3.5
18
3.7
20
3.8
Minitab output resulting from fitting a simple linear regression model with time as the explanatory variable and BOD as the response
follows.
Predictor
Coef
SE Coef
Constant
0.6578
0.1657
3.97
0.003
Time
0.17806
0.01400
12.72
0.000
S = 0.287281 R-Sq = 94.7% R-Sq(adj) = 94.1%
%3D
Analysis of Variance
Source
DF
SS
MS
F
P.
Regression
1.
13.344
13.344
161.69
0.000
6.
Expert Solution
This question has been solved!
Explore an expertly crafted, step-by-step solution for a thorough understanding of key concepts.

This is a popular solution!

Trending now
This is a popular solution!

Step by step
Solved in 2 steps with 2 images

Recommended textbooks for you
Linear Algebra: A Modern Introduction
Algebra
ISBN:
9781285463247
Author:
David Poole
Publisher:
Cengage Learning

Elementary Linear Algebra (MindTap Course List)
Algebra
ISBN:
9781305658004
Author:
Ron Larson
Publisher:
Cengage Learning

Glencoe Algebra 1, Student Edition, 9780079039897…
Algebra
ISBN:
9780079039897
Author:
Carter
Publisher:
McGraw Hill
Linear Algebra: A Modern Introduction
Algebra
ISBN:
9781285463247
Author:
David Poole
Publisher:
Cengage Learning
Elementary Linear Algebra (MindTap Course List)
Algebra
ISBN:
9781305658004
Author:
Ron Larson
Publisher:
Cengage Learning
Glencoe Algebra 1, Student Edition, 9780079039897…
Algebra
ISBN:
9780079039897
Author:
Carter
Publisher:
McGraw Hill