a, b, c is already solved please if you could solve questions d & e. Provide an appropriate response. The data below are the temperatures on randomly chosen days during the summer and the number of employee absences at a local company on those days. (a) Find the least square regression line. Round slope and y-intercept nearest hundredth. - solved (b) Predict the number of absences when temperature is 88. - solved (c) Find the residual when temperature is 98. Analyze the result. - solved (d) Test the claim, at the α = 0.05 level of significance, that a linear relation exists between the temperature and number of absences. Apply classical approach and p-value approach. - needs to get solved (e) Find 95 % confidence interval about the slope fo the true least-square regression line. Interpret the result. - needs to get solved


Correlation
Correlation defines a relationship between two independent variables. It tells the degree to which variables move in relation to each other. When two sets of data are related to each other, there is a correlation between them.
Linear Correlation
A correlation is used to determine the relationships between numerical and categorical variables. In other words, it is an indicator of how things are connected to one another. The correlation analysis is the study of how variables are related.
Regression Analysis
Regression analysis is a statistical method in which it estimates the relationship between a dependent variable and one or more independent variable. In simple terms dependent variable is called as outcome variable and independent variable is called as predictors. Regression analysis is one of the methods to find the trends in data. The independent variable used in Regression analysis is named Predictor variable. It offers data of an associated dependent variable regarding a particular outcome.
a, b, c is already solved please if you could solve questions d & e.
Provide an appropriate response.
The data below are the temperatures on randomly chosen days during the summer and the number of employee absences at a local company on those days.
(a) Find the least square regression line. Round slope and y-intercept nearest hundredth. - solved
(b) Predict the number of absences when temperature is 88. - solved
(c) Find the residual when temperature is 98. Analyze the result. - solved
(d) Test the claim, at the α = 0.05 level of significance, that a linear relation exists between the temperature and number of absences. Apply classical approach and p-value approach. - needs to get solved
(e) Find 95 % confidence interval about the slope fo the true least-square regression line. Interpret the result. - needs to get solved

Given:
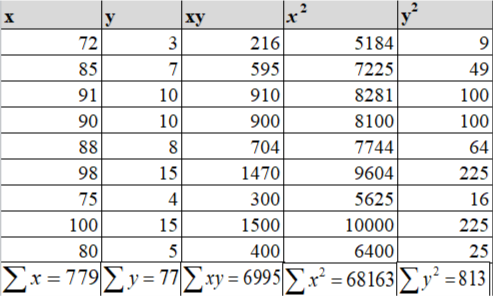
number of observation = 9
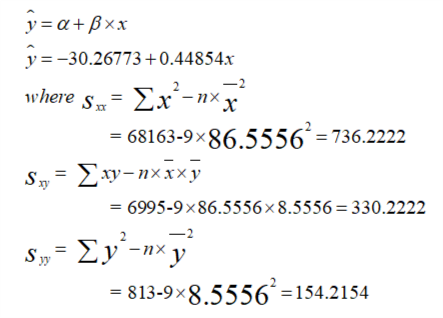
As the above parts are already solved so, the regression line of y on x (or number of absences on temperature) is
d)
Testing whether linear correlation exists between number of absences and temperature
The null hypothesis and alternate hypothesis are
H0 : β = 0 (there is no linear relation between number of absences and temperature)
H1 : β ≠ 0 (there exists linear relation between number of absences and temperature)
Degree of freedom = n - 1
9 - 1 = 8
Test static
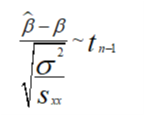
where
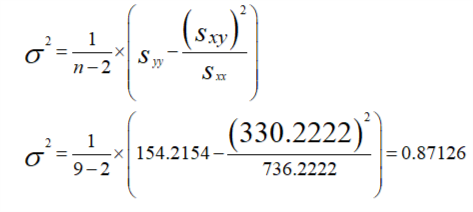
Under null hypothesis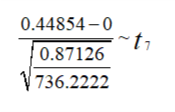
The test value is 13.03.
α = 0.05
The critical value t0.025|7 = 2.365
As the test static values does not lies between -2.365 and 2.365, so there is sufficient evidence to reject null hypothesis at 5% significant level and conclude that there exists a linear correlation between number of absences and temperature.
P value
The test is two tailed
P( t0.025|7 < 13.03 ) = 0.999998
P(t0.025|7 > 13.03 ) = 0.00000182609
P(t0.025|7 < -13.03 ) + P(t0.025|7 >13.03) = 0.00000365219
As P value < α , so there is sufficient evidence to reject null hypothesis at 5% significant level and conclude that there exists a linear correlation between number of absences and temperature.

Step by step
Solved in 3 steps with 6 images


