a. Find the least squares line relating ratio of repair to replacement cost (y) to pipe diameter (x) on the printout. b. Locate the value of SSE on the printout. Is there an- other line with an average error of 0 that has a smaller SSE than the line, part a? Explain. c. Interpret, practically, the values ß, and ß1 . d. Use the regression line to predict the ratio of repair to replacement cost of pipe with a diameter of 800 millimeters. e. Comment on the reliability of the prediction, part d.
a. Find the least squares line relating ratio of repair to replacement cost (y) to pipe diameter (x) on the printout. b. Locate the value of SSE on the printout. Is there an- other line with an average error of 0 that has a smaller SSE than the line, part a? Explain. c. Interpret, practically, the values ß, and ß1 . d. Use the regression line to predict the ratio of repair to replacement cost of pipe with a diameter of 800 millimeters. e. Comment on the reliability of the prediction, part d.

MATLAB: An Introduction with Applications
6th Edition
ISBN:9781119256830
Author:Amos Gilat
Publisher:Amos Gilat
Chapter1: Starting With Matlab
Section: Chapter Questions
Problem 1P

Related questions
Question
a, b, and c
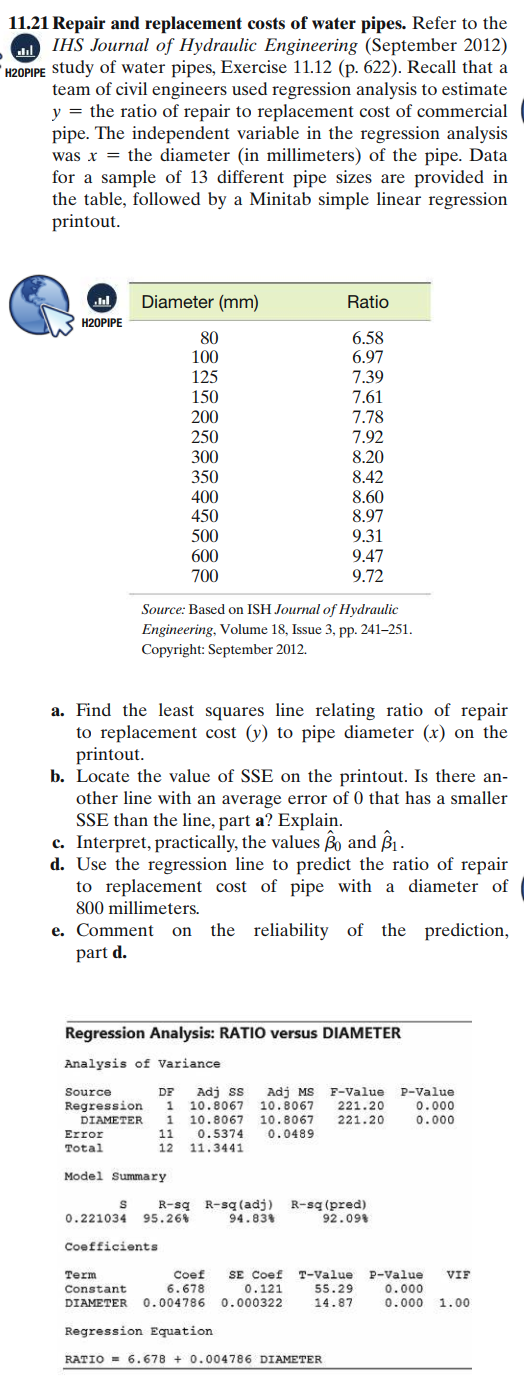
Transcribed Image Text:11.21 Repair and replacement costs of water pipes. Refer to the
IHS Journal of Hydraulic Engineering (September 2012)
H2OPIPE Study of water pipes, Exercise 11.12 (p. 622). Recall that a
team of civil engineers used regression analysis to estimate
y = the ratio of repair to replacement cost of commercial
pipe. The independent variable in the regression analysis
was x = the diameter (in millimeters) of the pipe. Data
for a sample of 13 different pipe sizes are provided in
the table, followed by a Minitab simple linear regression
printout.
Diameter (mm)
Ratio
H20PIPE
80
100
6.58
6.97
7.39
7.61
125
150
200
250
7.78
7.92
8.20
300
350
8.42
400
8.60
450
500
8.97
9.31
600
9.47
9.72
700
Source: Based on ISH Journal of Hydraulic
Engineering, Volume 18, Issue 3, pp. 241-251.
Copyright: September 2012.
a. Find the least squares line relating ratio of repair
to replacement cost (y) to pipe diameter (x) on the
printout.
b. Locate the value of SSE on the printout. Is there an-
other line with an average error of 0 that has a smaller
SSE than the line, part a? Explain.
c. Interpret, practically, the values r and ß, .
d. Use the regression line to predict the ratio of repair
to replacement cost of pipe with a diameter of
800 millimeters.
e. Comment
the reliability of the prediction,
on
part d.
Regression Analysis: RATIO versus DIAMETER
Analysis of Variance
Adj ss
10.8067 10.8067
10.8067 10.8067
Adj MS F-Value P-Value
0.000
0.000
Source
DF
221.20
Regression
DIAMETER
1
1
221.20
Error
11
0.5374
0.0489
Total
12
11.3441
Model Summary
R-sg R-sq (adj) R-sq (pred)
94.834
0.221034 95.26%
92.09%
Coefficionts
SE Coef T-Value P-Value
55.29
14.87
Term
Coef
VIF
Constant
DIAMETER
6.678
0.004786
0.121
0.000322
0.000
0.000 1.00
Regression Equation
RATIO = 6.678 + 0.004786 DIAMETER
Expert Solution
This question has been solved!
Explore an expertly crafted, step-by-step solution for a thorough understanding of key concepts.

This is a popular solution!

Trending now
This is a popular solution!

Step by step
Solved in 2 steps

Recommended textbooks for you
MATLAB: An Introduction with Applications
Statistics
ISBN:
9781119256830
Author:
Amos Gilat
Publisher:
John Wiley & Sons Inc

Probability and Statistics for Engineering and th…
Statistics
ISBN:
9781305251809
Author:
Jay L. Devore
Publisher:
Cengage Learning

Statistics for The Behavioral Sciences (MindTap C…
Statistics
ISBN:
9781305504912
Author:
Frederick J Gravetter, Larry B. Wallnau
Publisher:
Cengage Learning
MATLAB: An Introduction with Applications
Statistics
ISBN:
9781119256830
Author:
Amos Gilat
Publisher:
John Wiley & Sons Inc
Probability and Statistics for Engineering and th…
Statistics
ISBN:
9781305251809
Author:
Jay L. Devore
Publisher:
Cengage Learning
Statistics for The Behavioral Sciences (MindTap C…
Statistics
ISBN:
9781305504912
Author:
Frederick J Gravetter, Larry B. Wallnau
Publisher:
Cengage Learning

Elementary Statistics: Picturing the World (7th E…
Statistics
ISBN:
9780134683416
Author:
Ron Larson, Betsy Farber
Publisher:
PEARSON

The Basic Practice of Statistics
Statistics
ISBN:
9781319042578
Author:
David S. Moore, William I. Notz, Michael A. Fligner
Publisher:
W. H. Freeman

Introduction to the Practice of Statistics
Statistics
ISBN:
9781319013387
Author:
David S. Moore, George P. McCabe, Bruce A. Craig
Publisher:
W. H. Freeman