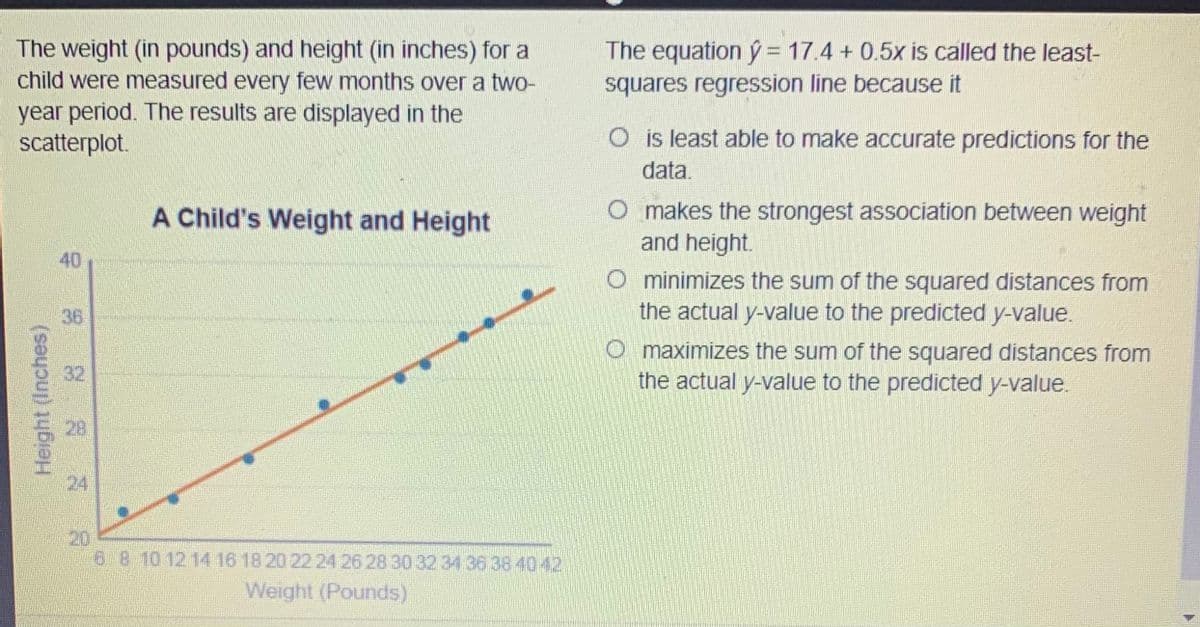
The weight (in pounds) and height (in inches) for a child were measured every few months over a two- The equation ý = 17.4 + 0.5x is called the least- squares regression line because it year period. The results are displayed in the scatterplot. O is least able to make accurate predictions for the data. O makes the strongest association between weight and height. A Child's Weight and Height 40 O minimizes the sum of the squared distances from the actual y-value to the predicted y-value. 36 O maximizes the sum of the squared distances from the actual y-value to the predicted y-value. 32 28 24 20 6 8 10 12 14 16 18 20 22 24 26 32 34 36 38 4042 Height (Inches)


Correlation
Correlation defines a relationship between two independent variables. It tells the degree to which variables move in relation to each other. When two sets of data are related to each other, there is a correlation between them.
Linear Correlation
A correlation is used to determine the relationships between numerical and categorical variables. In other words, it is an indicator of how things are connected to one another. The correlation analysis is the study of how variables are related.
Regression Analysis
Regression analysis is a statistical method in which it estimates the relationship between a dependent variable and one or more independent variable. In simple terms dependent variable is called as outcome variable and independent variable is called as predictors. Regression analysis is one of the methods to find the trends in data. The independent variable used in Regression analysis is named Predictor variable. It offers data of an associated dependent variable regarding a particular outcome.


Trending now
This is a popular solution!

Step by step
Solved in 2 steps with 2 images


