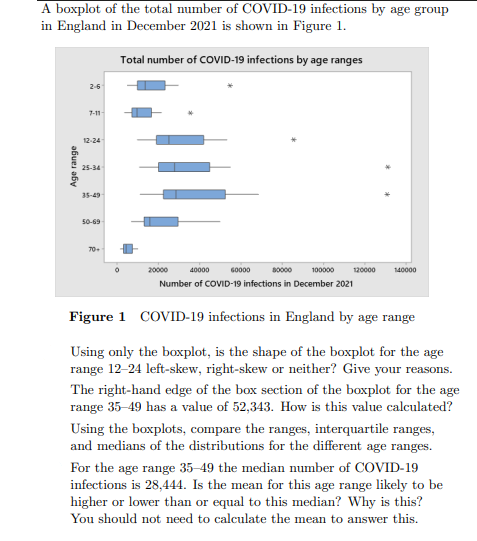
A boxplot of the total number of COVID-19 infections by age group in England in December 2021 is shown in Figure 1. Total number of COVID-19 infections by age ranges Age range 2-6 7-11- 12-24 25-34 35-49 50-69 20000 40000 Number of COVID-19 infections in December 2021 60000 80000 100000 120000 140000 Figure 1 COVID-19 infections in England by age range Using only the boxplot, is the shape of the boxplot for the age range 12-24 left-skew, right-skew or neither? Give your reasons. The right-hand edge of the box section of the boxplot for the age range 35-49 has a value of 52,343. How is this value calculated? Using the boxplots, compare the ranges, interquartile ranges, and medians of the distributions for the different age ranges. For the age range 35-49 the median number of COVID-19 infections is 28,444. Is the mean for this age range likely to be higher or lower than or equal to this median? Why is this? You should not need to calculate the mean to answer this.
A boxplot of the total number of COVID-19 infections by age group in England in December 2021 is shown in Figure 1. Total number of COVID-19 infections by age ranges Age range 2-6 7-11- 12-24 25-34 35-49 50-69 20000 40000 Number of COVID-19 infections in December 2021 60000 80000 100000 120000 140000 Figure 1 COVID-19 infections in England by age range Using only the boxplot, is the shape of the boxplot for the age range 12-24 left-skew, right-skew or neither? Give your reasons. The right-hand edge of the box section of the boxplot for the age range 35-49 has a value of 52,343. How is this value calculated? Using the boxplots, compare the ranges, interquartile ranges, and medians of the distributions for the different age ranges. For the age range 35-49 the median number of COVID-19 infections is 28,444. Is the mean for this age range likely to be higher or lower than or equal to this median? Why is this? You should not need to calculate the mean to answer this.

Linear Algebra: A Modern Introduction
4th Edition
ISBN:9781285463247
Author:David Poole
Publisher:David Poole
Chapter2: Systems Of Linear Equations
Section2.4: Applications
Problem 1EQ: 1. Suppose that, in Example 2.27, 400 units of food A, 600 units of B, and 600 units of C are placed...

Related questions
Question
Hello can you please help
Transcribed Image Text:A boxplot of the total number of COVID-19 infections by age group
in England in December 2021 is shown in Figure 1.
Total number of COVID-19 infections by age ranges
Age range
2-6
7-11-
12-24
25-34
35-49
50-69
70+
80000
40000
100000
Number of COVID-19 infections in December 2021
Figure 1 COVID-19 infections in England by age range
Using only the boxplot, is the shape of the boxplot for the age
range 12-24 left-skew, right-skew or neither? Give your reasons.
The right-hand edge of the box section of the boxplot for the age
range 35-49 has a value of 52,343. How is this value calculated?
Using the boxplots, compare the ranges, interquartile ranges,
and medians of the distributions for the different age ranges.
20000
60000
120000
140000
For the age range 35-49 the median number of COVID-19
infections is 28,444. Is the mean for this age range likely to be
higher or lower than or equal to this median? Why is this?
You should not need to calculate the mean to answer this.
Expert Solution
This question has been solved!
Explore an expertly crafted, step-by-step solution for a thorough understanding of key concepts.
Step 1: Write the given information.
VIEWStep 2: Determine the shape distribution for the age range 12 to 24 years.
VIEWStep 3: Estimate the ranges, interquartile ranges and median of the distributions using the box-plot.
VIEWStep 4: Determine whether the mean of the age range 35 to 49 years is less than or greater than median.
VIEWSolution
VIEW
Step by step
Solved in 5 steps

Recommended textbooks for you
Linear Algebra: A Modern Introduction
Algebra
ISBN:
9781285463247
Author:
David Poole
Publisher:
Cengage Learning


Algebra & Trigonometry with Analytic Geometry
Algebra
ISBN:
9781133382119
Author:
Swokowski
Publisher:
Cengage
Linear Algebra: A Modern Introduction
Algebra
ISBN:
9781285463247
Author:
David Poole
Publisher:
Cengage Learning
Algebra & Trigonometry with Analytic Geometry
Algebra
ISBN:
9781133382119
Author:
Swokowski
Publisher:
Cengage

Mathematics For Machine Technology
Advanced Math
ISBN:
9781337798310
Author:
Peterson, John.
Publisher:
Cengage Learning,