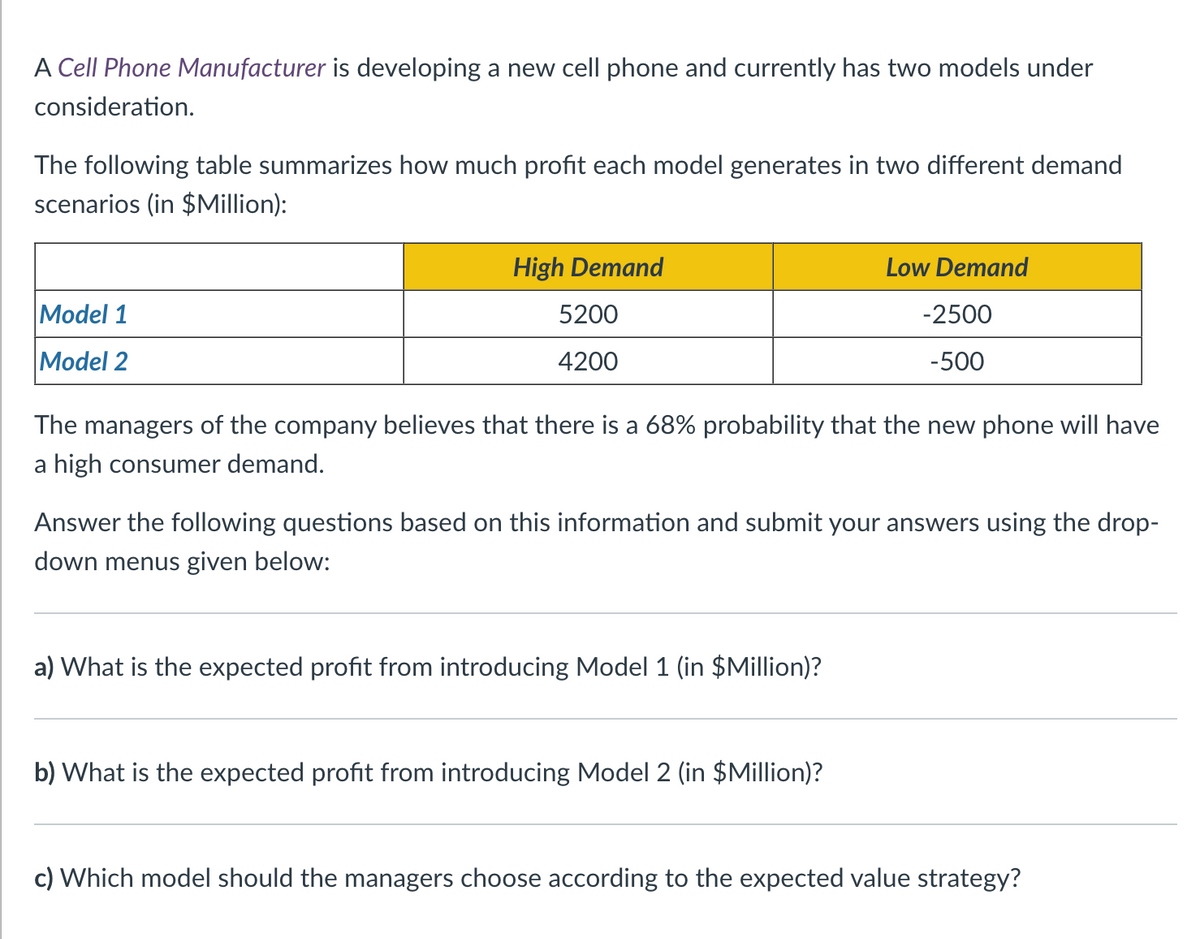
A Cell Phone Manufacturer is developing a new cell phone and currently has two models under consideration. The following table summarizes how much profit each model generates in two different demand scenarios (in $Million): Model 1 Model 2 High Demand 5200 4200 The managers of the company believes that there is a 68% probability that the new phone will have a high consumer demand. Low Demand -2500 -500 Answer the following questions based on this information and submit your answers using the drop- down menus given below: a) What is the expected profit from introducing Model 1 (in $Million)? b) What is the expected profit from introducing Model 2 (in $Million)? c) Which model should the managers choose according to the expected value strategy?


Q: Briefly discuss the following Are Costco’s prices too low? Why or why not?
A: Costco has satisfied its claim of offering items basically potential costs the organization has bun…
Q: Managing Southwest's capacity has been somewhat simplified by strate- gic decisions made early on in…
A: Capacity management is the process of planning activities, managing the task, and optimizing the…
Q: ements Toyota Mission and Vision Statements Facebook Mission and Core Values Statements Prudential…
A: Starbucks places a strong emphasis on leading the coffeehouse market and the industry at large, as…
Q: In a car maintenance workshop, as a manager how can you plan and control and the department’s…
A: As a manager, it is crucial to develop a comprehensive plan that sets financial goals, allocates…
Q: Lean development's benefits in five lines. Second, apply the lean principle from class to two…
A: Lean development is a development methodology that focuses on maximising value while minimising…
Q: The concept of Boundary Spanner in strategic management
A: Boundary spanning is the practice of reaching beyond traditional organizational boundaries to form…
Q: mportance of risk management from client's perspectives
A: Risk management is the process of identifying, assessing, and mitigating risks to minimize their…
Q: What is the estimated standard deviation for the critical path? Group of answer choices 2.78…
A: A network diagram shows the link of each task with the duration taken by each activity with respect…
Q: ustomers play a crucial role in an organization market environment as no organization can survive…
A: Customers are critical to the success and sustainability of any organisation in today's volatile…
Q: Given the following activity network: (3 activities A1, A2, & A3; arrows point from A1 to A2 & A1 to…
A: Find the Given details below: Activities Predecessor Duration A1 - 5 A2 A1 7 A3 A1 (4*50%)…
Q: These four actions constitute a machine cycle, often known as a process cycle. What variables most…
A: A computer's central processing unit (CPU) performs a sequence of operations known as "machine…
Q: F Question Viewer 16 E F 20 Based on the activity time estimates, the expected times for each of the…
A: Expected Time: The expected time represents the best estimate of the time required to complete an…
Q: Project managers can have a range of leadership styles that might be used in managing a development…
A: In Project management leadership is significant because strong leaders encourage their groups or…
Q: Business case: an architecture construction and interior design company with our own retail line. •…
A: The architecture, construction, and interior design industry is highly competitive, demanding…
Q: A trucking company owns two types of trucks. Type A has 10 cubic metres of refrigerated space and 10…
A: Suppose- x be the no. of number of A trucksy be the no. of number of B trucks
Q: Innovative Service Pricing Explore one highly successful business model based on innovation service…
A: Innovative service pricing and revenue management methods are critical in today's competitive…
Q: A consulting firm has four projects to consider. Each project will require time (in days) in the…
A: Find the Given details below: Project Time in first month Time in second month Time in…
Q: Critically discuss the role in (Oredoo Oman Company ) of leadership, technology, employees, and…
A: Oredoo Oman Company recognises the critical role of leadership, technology, workers, and customers…
Q: List and explain the attributes of Project quality Management
A: Project Quality Management is a vital component of project management that focuses on ensuring that…
Q: Piping Hot Pizza Limited (a company) is a client of your firm. They regularly ask your firm to…
A: To effectively assist Piping Hot Pizza Limited, our firm must have a thorough understanding of the…
Q: Design a research proposal in education and what can be contained in chapters one, two and three
A: Research Proposal: Enhancing Student Engagement through Gamification in Mathematics Education The…
Q: In evaluating the performance of an appointment system, ________ should be high and ________ should…
A: The evaluation of performance typically includes measuring and analyzing key indicators or…
Q: safety of our consumers.
A: Ensuring consumer safety is of utmost importance for any business or industry. However, there are…
Q: s the adoption of total flexibility possible in Zimbabwe
A: The adoption of total flexibility, which refers to a highly flexible and adaptable work environment,…
Q: explain , How can organizations develop and evaluate strategic alternatives
A: Strategic alternatives are various paths of action that an organization could at some time choose.…
Q: Argue how globalisation and the fourth industrial revolution could pose to be a challenge in…
A: Globalization and the fourth industrial revolution are closely intertwined as advances in technology…
Q: roject management has which of the following dimensions ? Economics dimension Initiation dimension…
A: Project management is the practice of planning, organizing, and controlling resources to achieve…
Q: Consider Amazon’s distribution network. How is Amazon using its distribution network to be both…
A: Amazon's distribution network is a global infrastructure comprised of fulfilment centres,…
Q: discuss importance of project resource planning and its impact on project success?
A: Project resource planning- in the project management is the base of each & every project. It…
Q: Firm A purchases cases of fertilizer for its lawn-care business from a supplier who charges $40 per…
A: Find the Calculation methods below: Economic Order Quantity = 2DSHD - Annual DemandS - Ordering…
Q: just-in-time (JIT)
A: (a) The benefits claimed for JIT in the quotation are achieved through various key principles and…
Q: Explain the concept of contingent workforce and discuss the benefits and challenges of utilizing…
A: The utilization of a contingent workforce, comprising temporary, contract, and freelance workers,…
Q: How can a person's personality affect their job search, employability, as well as predict their…
A: Here, I would explain how a person's personality could affect their job search, and employability…
Q: PA 15-4 A police station had to deploy a police officer... A police station had to deploy a police…
A:
Q: In the evaluation of financial statements, describe the typical information you need, data you…
A: Business information refers to data, facts, and knowledge that are relevant to the operations,…
Q: Which of the following is a match between the type of supply chain and the type of product? Group…
A: Supply chain management is all about managing supply chain activities effectively. All the…
Q: The average demand is 50 newspapers; Standard deviation is 20 newspapers. The corresponding lead…
A: Safety stock is a portion of inventory that help to meet any unpredictable variations in demand. A…
Q: Customers checking out at Food Mart arrive in a single-line queue served by two cashiers at a rate…
A: Find the Given details below: Arrival rate λ 8 Service rate μ 8 Cashiers s 2 Calculation…
Q: A company wants to locate a new warehouse to minimize the longest distance traveled by any of its…
A: Non-linear programming deals with the optimization of an objective function subject to constraints…
Q: Instructions Brainstorm ideas for 15 potential problems or areas of need or improvement that could…
A: Innovation is the process of introducing novel concepts, practises, goods, or services that lead to…
Q: How can optimization models be effectively applied in management decision-making processes to…
A: Decision-making is the process of choosing between alternative options based on a set of criteria,…
Q: Discuss how business process re-engineering may revamp a company's IT strategy.
A: Business process re-engineering (BPR) is a management strategy that tries to revamp and optimise an…
Q: C&A sells 600 bottles of a dietary supplement per week at $100 per bottle. The supplement is ordered…
A: Total ordering and holding cost can be calculated using the average inventory and number of orders…
Q: What is the overall duration of the project (in weeks)? 28 weeks What is the earliest week you could…
A: As per Bartleby guidelines, we can only solve the first three subparts of one question at a…
Q: a. Draw a network diagram (activity on node), compute the earliest start and finish times of each…
A: A network diagram shows the link of each task with the duration taken by each activity with respect…
Q: Situational leadership matches the leader’s behavior to the level of employee development and the…
A: Situational leadership is a leadership approach that emphasizes adapting leadership behavior to the…
Q: What distinguishes transform mapping from system images as methods of system analysis and design?
A: An interdisciplinary area of research called system design and analysis studies a system by looking…
Q: Kenna Kelenteng is an entrepreneur who found that she can innovatively use Serowe Rural…
A: Job analysis is crucial process for organisations to gather and analyse information about the…
Q: What are the typical procedures for obtaining authorization to modify a network in the context of…
A: In the context of employment with a sizable corporation, modifying a network requires proper…
Q: when a product undergoes rapid changes in the technology it carries, manufacturers generally enjoy…
A: Rapid changes in a product's technology indicate that the product's technological characteristics…


Trending now
This is a popular solution!

Step by step
Solved in 5 steps

- Based on Babich (1992). Suppose that each week each of 300 families buys a gallon of orange juice from company A, B, or C. Let pA denote the probability that a gallon produced by company A is of unsatisfactory quality, and define pB and pC similarly for companies B and C. If the last gallon of juice purchased by a family is satisfactory, the next week they will purchase a gallon of juice from the same company. If the last gallon of juice purchased by a family is not satisfactory, the family will purchase a gallon from a competitor. Consider a week in which A families have purchased juice A, B families have purchased juice B, and C families have purchased juice C. Assume that families that switch brands during a period are allocated to the remaining brands in a manner that is proportional to the current market shares of the other brands. For example, if a customer switches from brand A, there is probability B/(B + C) that he will switch to brand B and probability C/(B + C) that he will switch to brand C. Suppose that the market is currently divided equally: 10,000 families for each of the three brands. a. After a year, what will the market share for each firm be? Assume pA = 0.10, pB = 0.15, and pC = 0.20. (Hint: You will need to use the RISKBINOMLAL function to see how many people switch from A and then use the RISKBENOMIAL function again to see how many switch from A to B and from A to C. However, if your model requires more RISKBINOMIAL functions than the number allowed in the academic version of @RISK, remember that you can instead use the BENOM.INV (or the old CRITBENOM) function to generate binomially distributed random numbers. This takes the form =BINOM.INV (ntrials, psuccess, RAND()).) b. Suppose a 1% increase in market share is worth 10,000 per week to company A. Company A believes that for a cost of 1 million per year it can cut the percentage of unsatisfactory juice cartons in half. Is this worthwhile? (Use the same values of pA, pB, and pC as in part a.)Play Things is developing a new Lady Gaga doll. The company has made the following assumptions: The doll will sell for a random number of years from 1 to 10. Each of these 10 possibilities is equally likely. At the beginning of year 1, the potential market for the doll is two million. The potential market grows by an average of 4% per year. The company is 95% sure that the growth in the potential market during any year will be between 2.5% and 5.5%. It uses a normal distribution to model this. The company believes its share of the potential market during year 1 will be at worst 30%, most likely 50%, and at best 60%. It uses a triangular distribution to model this. The variable cost of producing a doll during year 1 has a triangular distribution with parameters 15, 17, and 20. The current selling price is 45. Each year, the variable cost of producing the doll will increase by an amount that is triangularly distributed with parameters 2.5%, 3%, and 3.5%. You can assume that once this change is generated, it will be the same for each year. You can also assume that the company will change its selling price by the same percentage each year. The fixed cost of developing the doll (which is incurred right away, at time 0) has a triangular distribution with parameters 5 million, 7.5 million, and 12 million. Right now there is one competitor in the market. During each year that begins with four or fewer competitors, there is a 25% chance that a new competitor will enter the market. Year t sales (for t 1) are determined as follows. Suppose that at the end of year t 1, n competitors are present (including Play Things). Then during year t, a fraction 0.9 0.1n of the company's loyal customers (last year's purchasers) will buy a doll from Play Things this year, and a fraction 0.2 0.04n of customers currently in the market ho did not purchase a doll last year will purchase a doll from Play Things this year. Adding these two provides the mean sales for this year. Then the actual sales this year is normally distributed with this mean and standard deviation equal to 7.5% of the mean. a. Use @RISK to estimate the expected NPV of this project. b. Use the percentiles in @ RISKs output to find an interval such that you are 95% certain that the companys actual NPV will be within this interval.Based on Grossman and Hart (1983). A salesperson for Fuller Brush has three options: (1) quit, (2) put forth a low level of effort, or (3) put forth a high level of effort. Suppose for simplicity that each salesperson will sell 0, 5000, or 50,000 worth of brushes. The probability of each sales amount depends on the effort level as described in the file P07_71.xlsx. If a salesperson is paid w dollars, he or she regards this as a benefit of w1/2 units. In addition, low effort costs the salesperson 0 benefit units, whereas high effort costs 50 benefit units. If a salesperson were to quit Fuller and work elsewhere, he or she could earn a benefit of 20 units. Fuller wants all salespeople to put forth a high level of effort. The question is how to minimize the cost of encouraging them to do so. The company cannot observe the level of effort put forth by a salesperson, but it can observe the size of his or her sales. Thus, the wage paid to the salesperson is completely determined by the size of the sale. This means that Fuller must determine w0, the wage paid for sales of 0; w5000, the wage paid for sales of 5000; and w50,000, the wage paid for sales of 50,000. These wages must be set so that the salespeople value the expected benefit from high effort more than quitting and more than low effort. Determine how to minimize the expected cost of ensuring that all salespeople put forth high effort. (This problem is an example of agency theory.)
- Suppose you have invested 25% of your portfolio in four different stocks. The mean and standard deviation of the annual return on each stock are shown in the file P11_46.xlsx. The correlations between the annual returns on the four stocks are also shown in this file. a. What is the probability that your portfolios annual return will exceed 30%? b. What is the probability that your portfolio will lose money during the year?The annual demand for Prizdol, a prescription drug manufactured and marketed by the NuFeel Company, is normally distributed with mean 50,000 and standard deviation 12,000. Assume that demand during each of the next 10 years is an independent random number from this distribution. NuFeel needs to determine how large a Prizdol plant to build to maximize its expected profit over the next 10 years. If the company builds a plant that can produce x units of Prizdol per year, it will cost 16 for each of these x units. NuFeel will produce only the amount demanded each year, and each unit of Prizdol produced will sell for 3.70. Each unit of Prizdol produced incurs a variable production cost of 0.20. It costs 0.40 per year to operate a unit of capacity. a. Among the capacity levels of 30,000, 35,000, 40,000, 45,000, 50,000, 55,000, and 60,000 units per year, which level maximizes expected profit? Use simulation to answer this question. b. Using the capacity from your answer to part a, NuFeel can be 95% certain that actual profit for the 10-year period will be between what two values?Software development is an inherently risky and uncertain process. For example, there are many examples of software that couldnt be finished by the scheduled release datebugs still remained and features werent ready. (Many people believe this was the case with Office 2007.) How might you simulate the development of a software product? What random inputs would be required? Which outputs would be of interest? Which measures of the probability distributions of these outputs would be most important?
- In August of the current year, a car dealer is trying to determine how many cars of the next model year to order. Each car ordered in August costs 20,000. The demand for the dealers next year models has the probability distribution shown in the file P10_12.xlsx. Each car sells for 25,000. If demand for next years cars exceeds the number of cars ordered in August, the dealer must reorder at a cost of 22,000 per car. Excess cars can be disposed of at 17,000 per car. Use simulation to determine how many cars to order in August. For your optimal order quantity, find a 95% confidence interval for the expected profit.Suppose that GLC earns a 2000 profit each time a person buys a car. We want to determine how the expected profit earned from a customer depends on the quality of GLCs cars. We assume a typical customer will purchase 10 cars during her lifetime. She will purchase a car now (year 1) and then purchase a car every five yearsduring year 6, year 11, and so on. For simplicity, we assume that Hundo is GLCs only competitor. We also assume that if the consumer is satisfied with the car she purchases, she will buy her next car from the same company, but if she is not satisfied, she will buy her next car from the other company. Hundo produces cars that satisfy 80% of its customers. Currently, GLC produces cars that also satisfy 80% of its customers. Consider a customer whose first car is a GLC car. If profits are discounted at 10% annually, use simulation to estimate the value of this customer to GLC. Also estimate the value of a customer to GLC if it can raise its customer satisfaction rating to 85%, to 90%, or to 95%. You can interpret the satisfaction value as the probability that a customer will not switch companies.A common decision is whether a company should buy equipment and produce a product in house or outsource production to another company. If sales volume is high enough, then by producing in house, the savings on unit costs will cover the fixed cost of the equipment. Suppose a company must make such a decision for a four-year time horizon, given the following data. Use simulation to estimate the probability that producing in house is better than outsourcing. If the company outsources production, it will have to purchase the product from the manufacturer for 25 per unit. This unit cost will remain constant for the next four years. The company will sell the product for 42 per unit. This price will remain constant for the next four years. If the company produces the product in house, it must buy a 500,000 machine that is depreciated on a straight-line basis over four years, and its cost of production will be 9 per unit. This unit cost will remain constant for the next four years. The demand in year 1 has a worst case of 10,000 units, a most likely case of 14,000 units, and a best case of 16,000 units. The average annual growth in demand for years 2-4 has a worst case of 7%, a most likely case of 15%, and a best case of 20%. Whatever this annual growth is, it will be the same in each of the years. The tax rate is 35%. Cash flows are discounted at 8% per year.
- W. L. Brown, a direct marketer of womens clothing, must determine how many telephone operators to schedule during each part of the day. W. L. Brown estimates that the number of phone calls received each hour of a typical eight-hour shift can be described by the probability distribution in the file P10_33.xlsx. Each operator can handle 15 calls per hour and costs the company 20 per hour. Each phone call that is not handled is assumed to cost the company 6 in lost profit. Considering the options of employing 6, 8, 10, 12, 14, or 16 operators, use simulation to determine the number of operators that minimizes the expected hourly cost (labor costs plus lost profits).Although the normal distribution is a reasonable input distribution in many situations, it does have two potential drawbacks: (1) it allows negative values, even though they may be extremely improbable, and (2) it is a symmetric distribution. Many situations are modelled better with a distribution that allows only positive values and is skewed to the right. Two of these that have been used in many real applications are the gamma and lognormal distributions. @RISK enables you to generate observations from each of these distributions. The @RISK function for the gamma distribution is RISKGAMMA, and it takes two arguments, as in =RISKGAMMA(3,10). The first argument, which must be positive, determines the shape. The smaller it is, the more skewed the distribution is to the right; the larger it is, the more symmetric the distribution is. The second argument determines the scale, in the sense that the product of it and the first argument equals the mean of the distribution. (The mean in this example is 30.) Also, the product of the second argument and the square root of the first argument is the standard deviation of the distribution. (In this example, it is 3(10=17.32.) The @RISK function for the lognormal distribution is RISKLOGNORM. It has two arguments, as in =RISKLOGNORM(40,10). These arguments are the mean and standard deviation of the distribution. Rework Example 10.2 for the following demand distributions. Do the simulated outputs have any different qualitative properties with these skewed distributions than with the triangular distribution used in the example? a. Gamma distribution with parameters 2 and 85 b. Gamma distribution with parameters 5 and 35 c. Lognormal distribution with mean 170 and standard deviation 60The eTech Company is a fairly recent entry in the electronic device area. The company competes with Apple. Samsung, and other well-known companies in the manufacturing and sales of personal handheld devices. Although eTech recognizes that it is a niche player and will likely remain so in the foreseeable future, it is trying to increase its current small market share in this huge competitive market. Jim Simons, VP of Production, and Catherine Dolans, VP of Marketing, have been discussing the possible addition of a new product to the companys current (rather limited) product line. The tentative name for this new product is ePlayerX. Jim and Catherine agree that the ePlayerX, which will feature a sleeker design and more memory, is necessary to compete successfully with the big boys, but they are also worried that the ePlayerX could cannibalize sales of their existing productsand that it could even detract from their bottom line. They must eventually decide how much to spend to develop and manufacture the ePlayerX and how aggressively to market it. Depending on these decisions, they must forecast demand for the ePlayerX, as well as sales for their existing products. They also realize that Apple. Samsung, and the other big players are not standing still. These competitors could introduce their own new products, which could have very negative effects on demand for the ePlayerX. The expected timeline for the ePlayerX is that development will take no more than a year to complete and that the product will be introduced in the market a year from now. Jim and Catherine are aware that there are lots of decisions to make and lots of uncertainties involved, but they need to start somewhere. To this end. Jim and Catherine have decided to base their decisions on a planning horizon of four years, including the development year. They realize that the personal handheld device market is very fluid, with updates to existing products occurring almost continuously. However, they believe they can include such considerations into their cost, revenue, and demand estimates, and that a four-year planning horizon makes sense. In addition, they have identified the following problem parameters. (In this first pass, all distinctions are binary: low-end or high-end, small-effect or large-effect, and so on.) In the absence of cannibalization, the sales of existing eTech products are expected to produce year I net revenues of 10 million, and the forecast of the annual increase in net revenues is 2%. The ePIayerX will be developed as either a low-end or a high-end product, with corresponding fixed development costs (1.5 million or 2.5 million), variable manufacturing costs ( 100 or 200). and selling prices (150 or 300). The fixed development cost is incurred now, at the beginning of year I, and the variable cost and selling price are assumed to remain constant throughout the planning horizon. The new product will be marketed either mildly aggressively or very aggressively, with corresponding costs. The costs of a mildly aggressive marketing campaign are 1.5 million in year 1 and 0.5 million annually in years 2 to 4. For a very aggressive campaign, these costs increase to 3.5 million and 1.5 million, respectively. (These marketing costs are not part of the variable cost mentioned in the previous bullet; they are separate.) Depending on whether the ePlayerX is a low-end or high-end produce the level of the ePlayerXs cannibalization rate of existing eTech products will be either low (10%) or high (20%). Each cannibalization rate affects only sales of existing products in years 2 to 4, not year I sales. For example, if the cannibalization rate is 10%, then sales of existing products in each of years 2 to 4 will be 10% below their projected values without cannibalization. A base case forecast of demand for the ePlayerX is that in its first year on the market, year 2, demand will be for 100,000 units, and then demand will increase by 5% annually in years 3 and 4. This base forecast is based on a low-end version of the ePlayerX and mildly aggressive marketing. It will be adjusted for a high-end will product, aggressive marketing, and competitor behavior. The adjustments with no competing product appear in Table 2.3. The adjustments with a competing product appear in Table 2.4. Each adjustment is to demand for the ePlayerX in each of years 2 to 4. For example, if the adjustment is 10%, then demand in each of years 2 to 4 will be 10% lower than it would have been in the base case. Demand and units sold are the samethat is, eTech will produce exactly what its customers demand so that no inventory or backorders will occur. Table 2.3 Demand Adjustments When No Competing Product Is Introduced Table 2.4 Demand Adjustments When a Competing Product Is Introduced Because Jim and Catherine are approaching the day when they will be sharing their plans with other company executives, they have asked you to prepare an Excel spreadsheet model that will answer the many what-if questions they expect to be asked. Specifically, they have asked you to do the following: You should enter all of the given data in an inputs section with clear labeling and appropriate number formatting. If you believe that any explanations are required, you can enter them in text boxes or cell comments. In this section and in the rest of the model, all monetary values (other than the variable cost and the selling price) should be expressed in millions of dollars, and all demands for the ePlayerX should be expressed in thousands of units. You should have a scenario section that contains a 0/1 variable for each of the binary options discussed here. For example, one of these should be 0 if the low-end product is chosen and it should be 1 if the high-end product is chosen. You should have a parameters section that contains the values of the various parameters listed in the case, depending on the values of the 0/1 variables in the previous bullet For example, the fixed development cost will be 1.5 million or 2.5 million depending on whether the 0/1 variable in the previous bullet is 0 or 1, and this can be calculated with a simple IF formula. You can decide how to implement the IF logic for the various parameters. You should have a cash flows section that calculates the annual cash flows for the four-year period. These cash flows include the net revenues from existing products, the marketing costs for ePlayerX, and the net revenues for sales of ePlayerX (To calculate these latter values, it will help to have a row for annual units sold of ePlayerX.) The cash flows should also include depreciation on the fixed development cost, calculated on a straight-line four-year basis (that is. 25% of the cost in each of the four years). Then, these annual revenues/costs should be summed for each year to get net cash flow before taxes, taxes should be calculated using a 32% tax rate, and taxes should be subtracted and depreciation should be added back in to get net cash flows after taxes. (The point is that depreciation is first subtracted, because it is not taxed, but then it is added back in after taxes have been calculated.) You should calculate the company's NPV for the four-year horizon using a discount rate of 10%. You can assume that the fixed development cost is incurred now. so that it is not discounted, and that all other costs and revenues are incurred at the ends of the respective years. You should accompany all of this with a line chart with three series: annual net revenues from existing products; annual marketing costs for ePlayerX; and annual net revenues from sales of ePlayerX. Once all of this is completed. Jim and Catherine will have a powerful tool for presentation purposes. By adjusting the 0/1 scenario variables, their audience will be able to see immediately, both numerically and graphically, the financial consequences of various scenarios.