A college entrance exam company determined that a score of 23 on the mathematics portion of the exam suggests that a student is ready for college-level mathematics. To achieve this goal, the company recommends that students take a core curriculum of math courses in high school. Suppose a random sample of 150 students who completed this core set of courses results in a mean math score of 23.6 on the college entrance exam with a standard deviation of 3.8. Do these results suggest that students who complete the core curricCulum are ready for college-level mathematics? That is, are they scoring above 23 on the math portion of the exam? Complete parts a) through d) below. a) State the appropriate null and alternative hypotheses. Fill in the correct answers below. The appropriate null and alternative hypotheses are Ho = 23 versus H: P 23 b) Verify that the requirements to perform the test using the t-distribution are satisfied. Check all that apply. LA. The students' test scores were independent of one another. YB. The students were randomly sampled. C. The sample size is larger than 30, OD. None of the requirements are satisfied. c) Use the P-value approach at the a = 0.05 level of significance to test the hypotheses in part (a). Identify the test statistic. to = (Round to two decimal places as needed.)
A college entrance exam company determined that a score of 23 on the mathematics portion of the exam suggests that a student is ready for college-level mathematics. To achieve this goal, the company recommends that students take a core curriculum of math courses in high school. Suppose a random sample of 150 students who completed this core set of courses results in a mean math score of 23.6 on the college entrance exam with a standard deviation of 3.8. Do these results suggest that students who complete the core curricCulum are ready for college-level mathematics? That is, are they scoring above 23 on the math portion of the exam? Complete parts a) through d) below. a) State the appropriate null and alternative hypotheses. Fill in the correct answers below. The appropriate null and alternative hypotheses are Ho = 23 versus H: P 23 b) Verify that the requirements to perform the test using the t-distribution are satisfied. Check all that apply. LA. The students' test scores were independent of one another. YB. The students were randomly sampled. C. The sample size is larger than 30, OD. None of the requirements are satisfied. c) Use the P-value approach at the a = 0.05 level of significance to test the hypotheses in part (a). Identify the test statistic. to = (Round to two decimal places as needed.)

MATLAB: An Introduction with Applications
6th Edition
ISBN:9781119256830
Author:Amos Gilat
Publisher:Amos Gilat
Chapter1: Starting With Matlab
Section: Chapter Questions
Problem 1P

Related questions

Concept explainers
Contingency Table
A contingency table can be defined as the visual representation of the relationship between two or more categorical variables that can be evaluated and registered. It is a categorical version of the scatterplot, which is used to investigate the linear relationship between two variables. A contingency table is indeed a type of frequency distribution table that displays two variables at the same time.
Binomial Distribution
Binomial is an algebraic expression of the sum or the difference of two terms. Before knowing about binomial distribution, we must know about the binomial theorem.
Topic Video
Question
100%
Solve question (c) please
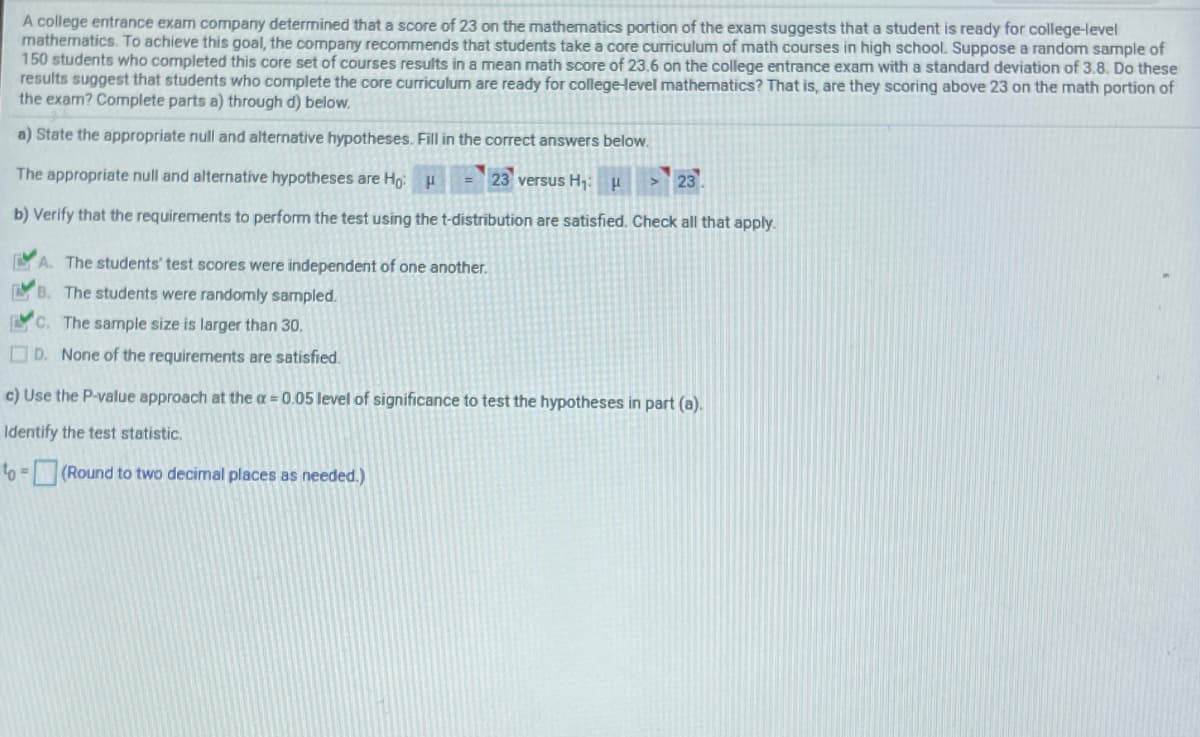
Transcribed Image Text:A college entrance exam company determined that a score of 23 on the mathematics portion of the exam suggests that a student is ready for college-level
mathematics. To achieve this goal, the company recommends that students take a core curriculum of math courses in high school. Suppose a random sample of
150 students who completed this core set of courses results in a mean math score of 23.6 on the college entrance exam with a standard deviation of 3.8. Do these
results suggest that students who complete the core curriculum are ready for college-level mathematics? That is, are they scoring above 23 on the math portion of
the exam? Complete parts a) through d) below.
a) State the appropriate null and alternative hypotheses. Fill in the correct answers below.
The appropriate null and alternative hypotheses are Ho:
= 23 versus H: P
23
b) Verify that the requirements to perform the test using the t-distribution are satisfied. Check all that apply.
LA. The students' test scores were independent of one another.
YB. The students were randomly sampled.
C. The sample size is larger than 30.
OD. None of the requirements are satisfied.
c) Use the P-value approach at the a = 0.05 level of significance to test the hypotheses in part (a).
Identify the test statistic.
to = (Round to two decimal places as needed.)
Expert Solution
This question has been solved!
Explore an expertly crafted, step-by-step solution for a thorough understanding of key concepts.

This is a popular solution!

Trending now
This is a popular solution!

Step by step
Solved in 3 steps with 2 images

Knowledge Booster


Learn more about
Need a deep-dive on the concept behind this application? Look no further. Learn more about this topic, statistics and related others by exploring similar questions and additional content below.Recommended textbooks for you
MATLAB: An Introduction with Applications
Statistics
ISBN:
9781119256830
Author:
Amos Gilat
Publisher:
John Wiley & Sons Inc

Probability and Statistics for Engineering and th…
Statistics
ISBN:
9781305251809
Author:
Jay L. Devore
Publisher:
Cengage Learning

Statistics for The Behavioral Sciences (MindTap C…
Statistics
ISBN:
9781305504912
Author:
Frederick J Gravetter, Larry B. Wallnau
Publisher:
Cengage Learning
MATLAB: An Introduction with Applications
Statistics
ISBN:
9781119256830
Author:
Amos Gilat
Publisher:
John Wiley & Sons Inc
Probability and Statistics for Engineering and th…
Statistics
ISBN:
9781305251809
Author:
Jay L. Devore
Publisher:
Cengage Learning
Statistics for The Behavioral Sciences (MindTap C…
Statistics
ISBN:
9781305504912
Author:
Frederick J Gravetter, Larry B. Wallnau
Publisher:
Cengage Learning

Elementary Statistics: Picturing the World (7th E…
Statistics
ISBN:
9780134683416
Author:
Ron Larson, Betsy Farber
Publisher:
PEARSON

The Basic Practice of Statistics
Statistics
ISBN:
9781319042578
Author:
David S. Moore, William I. Notz, Michael A. Fligner
Publisher:
W. H. Freeman

Introduction to the Practice of Statistics
Statistics
ISBN:
9781319013387
Author:
David S. Moore, George P. McCabe, Bruce A. Craig
Publisher:
W. H. Freeman