A company are trying to establish if there is a link between the type of fault reported in production and the production method. The number of faulty com- ponents produced is recorded during one week, counted by production method and type of fault. The results are shown in the following table. Fault A Fault B Fault C Fault D Method 1 23 25 16 19 Method 2 27 26 23 23 Method 3 26 23 18 8. Answer the following question parts. (a) Show the calculations that must be done for any two cells when calculating the sample value of the test statistic Q shown here. = 5.90. E, (b) Carry out an appropriate statistical test to determine whether there is a link between the type of fault reported and the production method
A company are trying to establish if there is a link between the type of fault reported in production and the production method. The number of faulty com- ponents produced is recorded during one week, counted by production method and type of fault. The results are shown in the following table. Fault A Fault B Fault C Fault D Method 1 23 25 16 19 Method 2 27 26 23 23 Method 3 26 23 18 8. Answer the following question parts. (a) Show the calculations that must be done for any two cells when calculating the sample value of the test statistic Q shown here. = 5.90. E, (b) Carry out an appropriate statistical test to determine whether there is a link between the type of fault reported and the production method

Algebra & Trigonometry with Analytic Geometry
13th Edition
ISBN:9781133382119
Author:Swokowski
Publisher:Swokowski
Chapter10: Sequences, Series, And Probability
Section10.8: Probability
Problem 32E

Related questions
Question
Hello, Could you please go through all of the following question. Thank you.
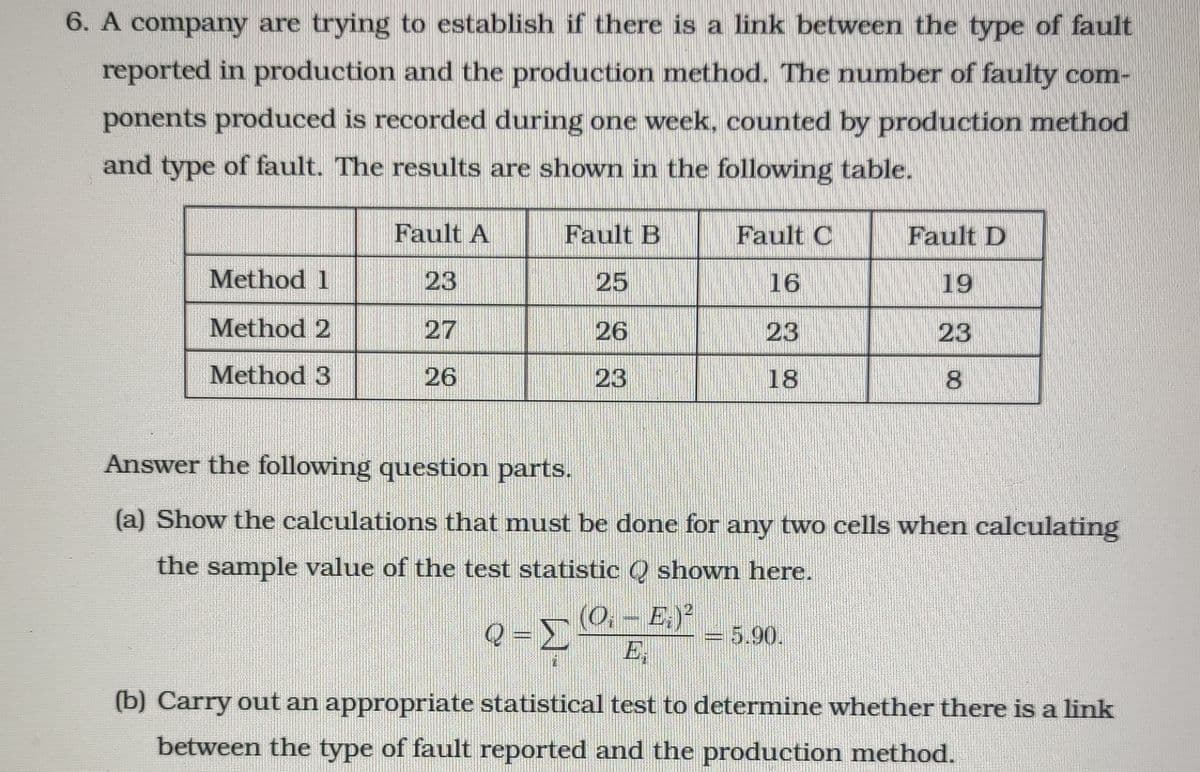
Transcribed Image Text:6. A company are trying to establish if there is a link between the type of fault
reported in production and the production method. The number of faulty com-
ponents produced is recorded during one week, counted by production method
and type of fault. The results are shown in the following table.
Fault A
Fault B
Fault C
Fault D
Method 1
23
25
16
19
Method 2
27
26
23
23
Method 3
26
23
18
Answer the following question parts.
(a) Show the calculations that must be done for any two cells when calculating
the sample value of the test statistic Q shown here.
(0,-E.)*
E,
5.90.
(b) Carry out an appropriate statistical test to determine whether there is a link
between the type of fault reported and the production method.
Expert Solution
This question has been solved!
Explore an expertly crafted, step-by-step solution for a thorough understanding of key concepts.

Step by step
Solved in 2 steps with 4 images

Recommended textbooks for you
Algebra & Trigonometry with Analytic Geometry
Algebra
ISBN:
9781133382119
Author:
Swokowski
Publisher:
Cengage

College Algebra (MindTap Course List)
Algebra
ISBN:
9781305652231
Author:
R. David Gustafson, Jeff Hughes
Publisher:
Cengage Learning
Algebra & Trigonometry with Analytic Geometry
Algebra
ISBN:
9781133382119
Author:
Swokowski
Publisher:
Cengage
College Algebra (MindTap Course List)
Algebra
ISBN:
9781305652231
Author:
R. David Gustafson, Jeff Hughes
Publisher:
Cengage Learning