A company wants to assess the impact of R & D expenditure on its annual profit. The following table presents the information for the last eight| years. Years 1991 1992 1993 1994 1995 R & D expenditure 1996 1997 1998 "000): 9. 7 10 4 3 2 Annual profit 45 42 41 60 30 34 25 20 Estimate the regression and predict the annual profit for 2002 for an allocated sum of Rs. 100,000 as R & D expenditure.
A company wants to assess the impact of R & D expenditure on its annual profit. The following table presents the information for the last eight| years. Years 1991 1992 1993 1994 1995 R & D expenditure 1996 1997 1998 "000): 9. 7 10 4 3 2 Annual profit 45 42 41 60 30 34 25 20 Estimate the regression and predict the annual profit for 2002 for an allocated sum of Rs. 100,000 as R & D expenditure.

Glencoe Algebra 1, Student Edition, 9780079039897, 0079039898, 2018
18th Edition
ISBN:9780079039897
Author:Carter
Publisher:Carter
Chapter4: Equations Of Linear Functions
Section4.6: Regression And Median-fit Lines
Problem 4GP

Related questions
Question
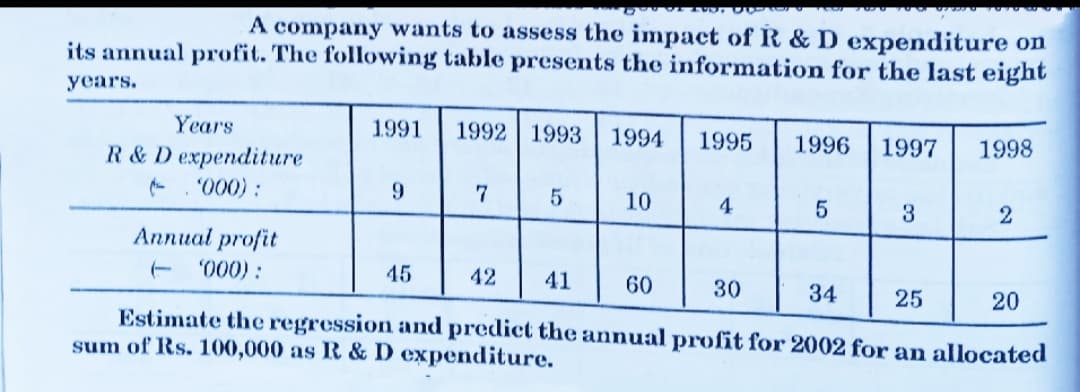
Transcribed Image Text:A company wants to assess the impact of R & D expenditure on
its annual profit. The following table presents the information for the last eight
years.
Years
1991
1992 | 1993
1994
1995
1996
1997
1998
R & D expenditure
- . "000) :
9.
7
5
10
4
3
Annual profit
"000):
45
42
41
60
30
34
25
20
Estimate the regression and predict the annual profit for 2002 for an allocated
sum of Rs. 100,000 as R & D expenditure.
Expert Solution
This question has been solved!
Explore an expertly crafted, step-by-step solution for a thorough understanding of key concepts.

Step by step
Solved in 3 steps with 3 images

Recommended textbooks for you
Glencoe Algebra 1, Student Edition, 9780079039897…
Algebra
ISBN:
9780079039897
Author:
Carter
Publisher:
McGraw Hill

Linear Algebra: A Modern Introduction
Algebra
ISBN:
9781285463247
Author:
David Poole
Publisher:
Cengage Learning

College Algebra
Algebra
ISBN:
9781305115545
Author:
James Stewart, Lothar Redlin, Saleem Watson
Publisher:
Cengage Learning
Glencoe Algebra 1, Student Edition, 9780079039897…
Algebra
ISBN:
9780079039897
Author:
Carter
Publisher:
McGraw Hill
Linear Algebra: A Modern Introduction
Algebra
ISBN:
9781285463247
Author:
David Poole
Publisher:
Cengage Learning
College Algebra
Algebra
ISBN:
9781305115545
Author:
James Stewart, Lothar Redlin, Saleem Watson
Publisher:
Cengage Learning

Functions and Change: A Modeling Approach to Coll…
Algebra
ISBN:
9781337111348
Author:
Bruce Crauder, Benny Evans, Alan Noell
Publisher:
Cengage Learning