a) Construct scatter diagram and define pattern of the data b) Find the equation of regression line, and use it to predict the elongation when the tensile force is 100 thousand pounds. C) Find correlation coefficient "r", and interpret your results.
a) Construct scatter diagram and define pattern of the data b) Find the equation of regression line, and use it to predict the elongation when the tensile force is 100 thousand pounds. C) Find correlation coefficient "r", and interpret your results.

Glencoe Algebra 1, Student Edition, 9780079039897, 0079039898, 2018
18th Edition
ISBN:9780079039897
Author:Carter
Publisher:Carter
Chapter10: Statistics
Section10.5: Comparing Sets Of Data
Problem 11PPS

Related questions
Question
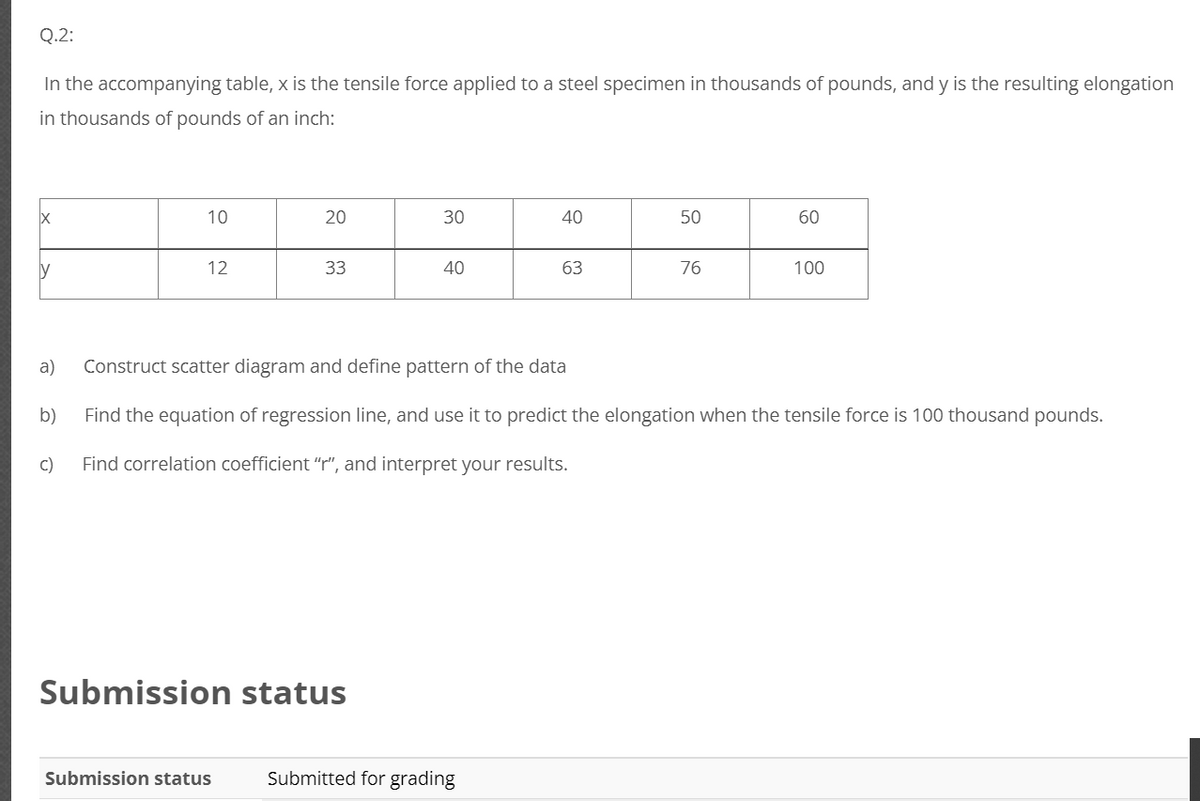
Transcribed Image Text:Q.2:
In the accompanying table, x is the tensile force applied to a steel specimen in thousands of pounds, and y is the resulting elongation
in thousands of pounds of an inch:
10
20
30
40
50
60
ly
12
33
40
63
76
100
a)
Construct scatter diagram and define pattern of the data
b)
Find the equation of regression line, and use it to predict the elongation when the tensile force is 100 thousand pounds.
C)
Find correlation coefficient “r", and interpret your results.
Submission status
Submission status
Submitted for grading
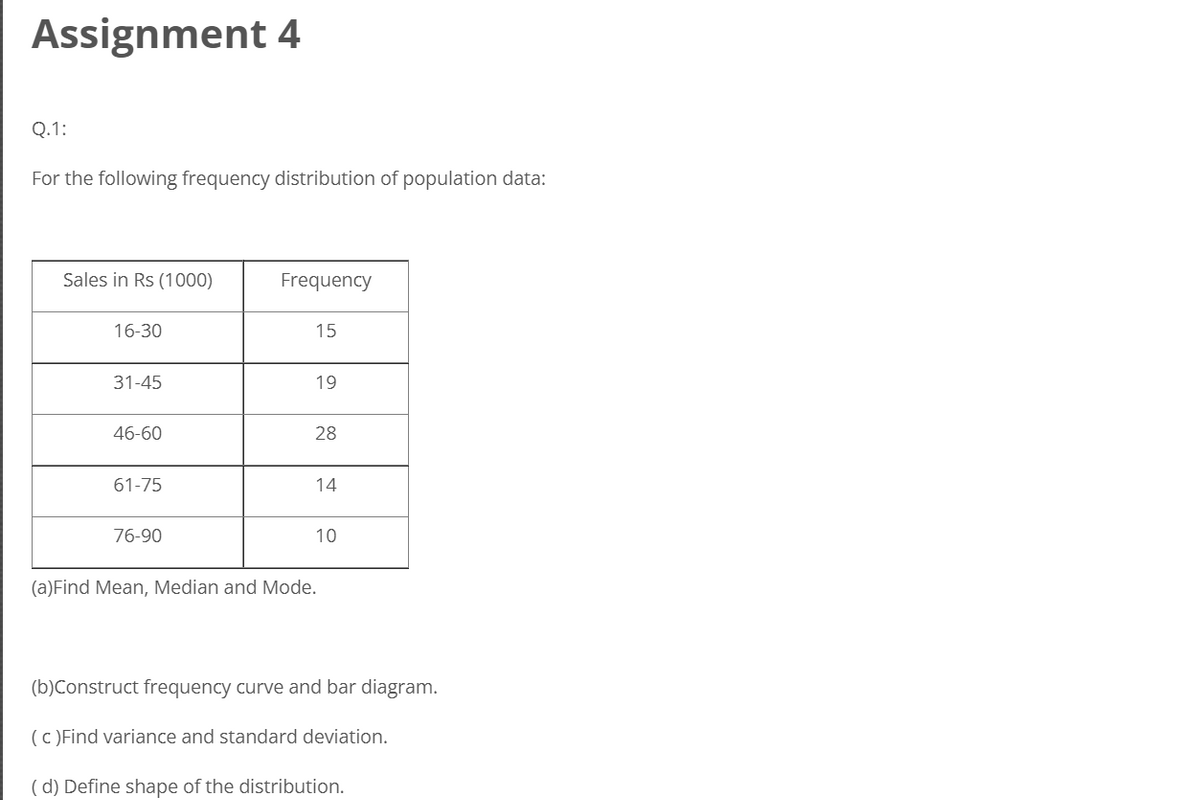
Transcribed Image Text:Assignment 4
Q.1:
For the following frequency distribution of population data:
Sales in Rs (1000)
Frequency
16-30
15
31-45
19
46-60
28
61-75
14
76-90
10
(a)Find Mean, Median and Mode.
(b)Construct frequency curve and bar diagram.
( c)Find variance and standard deviation.
(d) Define shape of the distribution.
Expert Solution
This question has been solved!
Explore an expertly crafted, step-by-step solution for a thorough understanding of key concepts.

Step by step
Solved in 2 steps with 1 images

Recommended textbooks for you
Glencoe Algebra 1, Student Edition, 9780079039897…
Algebra
ISBN:
9780079039897
Author:
Carter
Publisher:
McGraw Hill
Glencoe Algebra 1, Student Edition, 9780079039897…
Algebra
ISBN:
9780079039897
Author:
Carter
Publisher:
McGraw Hill