A doctor wanted to determine whether there is a relation between a male's age and his HDL (so-called good) cholesterol. The doctor randomly selected 17 of his patients and determined their HDL cholesterol. The data obtained by the doctor is the in the data table below. Complete parts (a) through (f) below. Click the icon to view the data obtained by the doctor. (d) Assuming the residuals are normally distributed, test whether a linear relation exists between age and H What are the null and alternative hypotheses? Age vs. HDL cholesterol data A. Ho: B =0; H: B, #0 Age, x HDL Cholesterol, y Age, x HDL Cholesterol, y O B. Ho: P, =0: H,: B, >0 56 38 40 45 42 55 34 57 37 67 31 52 29 50 49 37 O C. Ho: P, = 0; H,: B, <0 63 55 46 33 38 Use technology to compute the P-value. Use the Tech Help button for further assistance. 56 52 63 59 24 44 41 36 The P-value is 0.734. 44 57 38 48 (Round to three decimal places as needed.) 26 What conclusion can be drawn at a = 0.01 level of significance? O A. Do not reject the null hypothesis because the P-value is less than a = 0.01. OB. Reject the null hypothesis because the P-value is greater than a = 0.01. Print Done c. Do not reject the null hypothesis because the P-value is greater than a = 0.01. O D. Reject the null hypothesis because the P-value is less than a = 0.01. (e) Assuming the residuals are normally distributed, construct a 95% confidence interval about the slope of the true least-squares regression line. Lower Bound = Upper Bound = (Round to three decimal places as needed.)
A doctor wanted to determine whether there is a relation between a male's age and his HDL (so-called good) cholesterol. The doctor randomly selected 17 of his patients and determined their HDL cholesterol. The data obtained by the doctor is the in the data table below. Complete parts (a) through (f) below. Click the icon to view the data obtained by the doctor. (d) Assuming the residuals are normally distributed, test whether a linear relation exists between age and H What are the null and alternative hypotheses? Age vs. HDL cholesterol data A. Ho: B =0; H: B, #0 Age, x HDL Cholesterol, y Age, x HDL Cholesterol, y O B. Ho: P, =0: H,: B, >0 56 38 40 45 42 55 34 57 37 67 31 52 29 50 49 37 O C. Ho: P, = 0; H,: B, <0 63 55 46 33 38 Use technology to compute the P-value. Use the Tech Help button for further assistance. 56 52 63 59 24 44 41 36 The P-value is 0.734. 44 57 38 48 (Round to three decimal places as needed.) 26 What conclusion can be drawn at a = 0.01 level of significance? O A. Do not reject the null hypothesis because the P-value is less than a = 0.01. OB. Reject the null hypothesis because the P-value is greater than a = 0.01. Print Done c. Do not reject the null hypothesis because the P-value is greater than a = 0.01. O D. Reject the null hypothesis because the P-value is less than a = 0.01. (e) Assuming the residuals are normally distributed, construct a 95% confidence interval about the slope of the true least-squares regression line. Lower Bound = Upper Bound = (Round to three decimal places as needed.)

Glencoe Algebra 1, Student Edition, 9780079039897, 0079039898, 2018
18th Edition
ISBN:9780079039897
Author:Carter
Publisher:Carter
Chapter10: Statistics
Section10.4: Distributions Of Data
Problem 22PFA

Related questions
Question
What is the lower bound and Upper bound
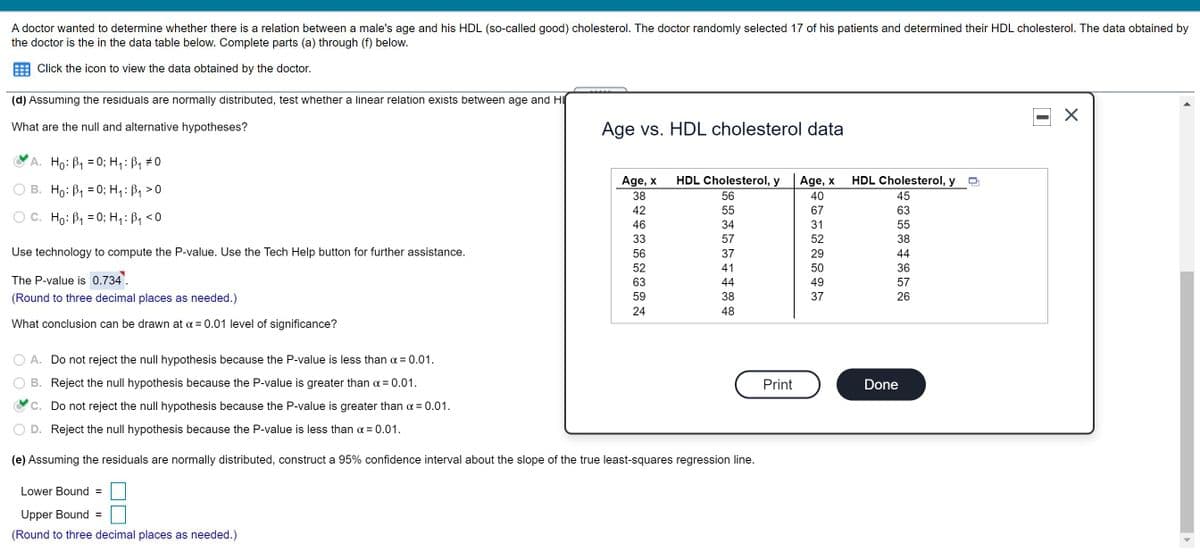
Transcribed Image Text:A doctor wanted to determine whether there is a relation between a male's age and his HDL (so-called good) cholesterol. The doctor randomly selected 17 of his patients and determined their HDL cholesterol. The data obtained by
the doctor is the in the data table below. Complete parts (a) through (f) below.
Click the icon to view the data obtained by the doctor.
(d) Assuming the residuals are normally distributed, test whether a linear relation exists between age and H
What are the null and alternative hypotheses?
Age vs. HDL cholesterol data
A. Ho: B1 = 0; H,: B, #0
Age, x
HDL Cholesterol, y
HDL Cholesterol, y
TTIT
Age, x
B. Ho: B1 = 0; H, :ß1 >0
38
56
40
45
42
55
67
63
C. Ho: B1 = 0; H1:B, <0
46
34
31
55
33
57
52
38
Use technology to compute the P-value. Use the Tech Help button for further assistance.
56
37
29
44
52
41
50
36
The P-value is 0.734'.
63
44
49
57
(Round to three decimal places as needed.)
59
38
37
26
24
48
What conclusion can be drawn at a = 0.01 level of significance?
A. Do not reject the null hypothesis because the P-value is less than a = 0.01.
B. Reject the null hypothesis because the P-value is greater than a = 0.01.
Print
Done
C. Do not reject the null hypothesis because the P-value is greater than a = 0.01.
Reject the null hypothesis because the P-value is less than a = 0.01.
(e) Assuming the residuals are normally distributed, construct a 95% confidence interval about the slope of the true least-squares regression line.
Lower Bound =
Upper Bound =
(Round to three decimal places as needed.)
Expert Solution
This question has been solved!
Explore an expertly crafted, step-by-step solution for a thorough understanding of key concepts.

This is a popular solution!

Trending now
This is a popular solution!

Step by step
Solved in 2 steps with 2 images

Recommended textbooks for you
Glencoe Algebra 1, Student Edition, 9780079039897…
Algebra
ISBN:
9780079039897
Author:
Carter
Publisher:
McGraw Hill

Big Ideas Math A Bridge To Success Algebra 1: Stu…
Algebra
ISBN:
9781680331141
Author:
HOUGHTON MIFFLIN HARCOURT
Publisher:
Houghton Mifflin Harcourt
Glencoe Algebra 1, Student Edition, 9780079039897…
Algebra
ISBN:
9780079039897
Author:
Carter
Publisher:
McGraw Hill
Big Ideas Math A Bridge To Success Algebra 1: Stu…
Algebra
ISBN:
9781680331141
Author:
HOUGHTON MIFFLIN HARCOURT
Publisher:
Houghton Mifflin Harcourt