The table gives the weight a (thousands of pounds) and available heat energy y (million BTU) of a standard cord of various species of wood typically used for heating. Perform a complete analysis of the data in analogy with the discussion in this section (that is, make a scatter plot, do preliminary computations, find the least squares regression line, find SSE, se, and r, and so on). In the hypothesis test, use as the alternative hypothesis B1 > 0, and test at the 5% level of significance. Use confidence level 95% for the confidence interval for B. Construct 95% confidence and predictions intervals at æp = 5 at the end. x 3.37 3.50 4.29 4.00 4.64 y 23.6 17.5 20.1 21.6 28.1 x 4.99 4.94 5.48 3.26 4.16 y 25.3 27.0 30.7 18.9 20.7
The table gives the weight a (thousands of pounds) and available heat energy y (million BTU) of a standard cord of various species of wood typically used for heating. Perform a complete analysis of the data in analogy with the discussion in this section (that is, make a scatter plot, do preliminary computations, find the least squares regression line, find SSE, se, and r, and so on). In the hypothesis test, use as the alternative hypothesis B1 > 0, and test at the 5% level of significance. Use confidence level 95% for the confidence interval for B. Construct 95% confidence and predictions intervals at æp = 5 at the end. x 3.37 3.50 4.29 4.00 4.64 y 23.6 17.5 20.1 21.6 28.1 x 4.99 4.94 5.48 3.26 4.16 y 25.3 27.0 30.7 18.9 20.7

Linear Algebra: A Modern Introduction
4th Edition
ISBN:9781285463247
Author:David Poole
Publisher:David Poole
Chapter7: Distance And Approximation
Section7.3: Least Squares Approximation
Problem 31EQ

Related questions
Question
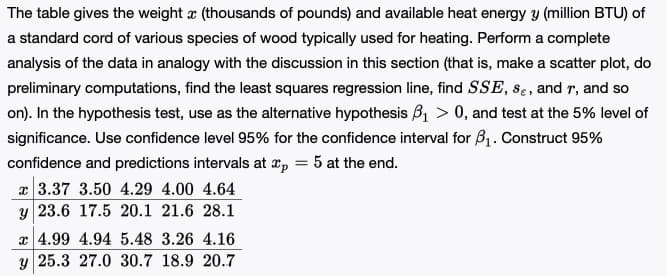
Transcribed Image Text:The table gives the weight r (thousands of pounds) and available heat energy y (million BTU) of
a standard cord of various species of wood typically used for heating. Perform a complete
analysis of the data in analogy with the discussion in this section (that is, make a scatter plot, do
preliminary computations, find the least squares regression line, find SSE, se, and r, and so
on). In the hypothesis test, use as the alternative hypothesis B, > 0, and test at the 5% level of
significance. Use confidence level 95% for the confidence interval for B1. Construct 95%
confidence and predictions intervals at xp = 5 at the end.
x 3.37 3.50 4.29 4.00 4.64
y 23.6 17.5 20.1 21.6 28.1
x 4.99 4.94 5.48 3.26 4.16
y 25.3 27.0 30.7 18.9 20.7
Expert Solution
This question has been solved!
Explore an expertly crafted, step-by-step solution for a thorough understanding of key concepts.

This is a popular solution!

Trending now
This is a popular solution!

Step by step
Solved in 4 steps with 4 images

Recommended textbooks for you
Linear Algebra: A Modern Introduction
Algebra
ISBN:
9781285463247
Author:
David Poole
Publisher:
Cengage Learning

Elementary Linear Algebra (MindTap Course List)
Algebra
ISBN:
9781305658004
Author:
Ron Larson
Publisher:
Cengage Learning
Linear Algebra: A Modern Introduction
Algebra
ISBN:
9781285463247
Author:
David Poole
Publisher:
Cengage Learning
Elementary Linear Algebra (MindTap Course List)
Algebra
ISBN:
9781305658004
Author:
Ron Larson
Publisher:
Cengage Learning