A genetic experiment involving peas yielded one sample of offspring consisting of 425 green peas and 159 yellow peas. Use a 0.01 significance level to test the claim that under the same circumstances, 25% of offspring peas will be yellow. Identify the null hypothesis, alternative hypothesis, test statistic, P-value, conclusion about the null hypothesis, and final conclusion that addresses the original claim. Use the P-value method and the normal distribution as an approximation to the binomial distribution. ..... - -- O E. Ho: p#0.25 O F. Ho: p= 0.25 H1:p<0.25 H1: p>0.25 What is the test statistic? z= (Round to two decimal places as needed.) What is the P-value? P-value = (Round to four decimal places as needed.) What is the conclusion about the null hypothesis? O A. Reject the null hypothesis because the P-value is greater than the significance level, a. O B. Fail to reject the null hypothesis because the P-value is less than or equal to the significance level, a. O C. Fail to reject the null hypothesis because the P-value is greater than the significance level, a. O D. Reject the null hypothesis because the P-value is less than or equal to the significance level, a. What is the final conclusion? O A. There is not sufficient evidence to support the claim that less than 25% of offspring peas will be yellow. O B. There is not sufficient evidence to warrant rejection of the claim that 25% of offspring peas will be yellow. OC. There is sufficient evidence to support the claim that less than 25% of offspring peas will be yellow. O D. There is sufficient evidence to warrant rejection of the claim that 25% of offspring peas will be yellow.
A genetic experiment involving peas yielded one sample of offspring consisting of 425 green peas and 159 yellow peas. Use a 0.01 significance level to test the claim that under the same circumstances, 25% of offspring peas will be yellow. Identify the null hypothesis, alternative hypothesis, test statistic, P-value, conclusion about the null hypothesis, and final conclusion that addresses the original claim. Use the P-value method and the normal distribution as an approximation to the binomial distribution. ..... - -- O E. Ho: p#0.25 O F. Ho: p= 0.25 H1:p<0.25 H1: p>0.25 What is the test statistic? z= (Round to two decimal places as needed.) What is the P-value? P-value = (Round to four decimal places as needed.) What is the conclusion about the null hypothesis? O A. Reject the null hypothesis because the P-value is greater than the significance level, a. O B. Fail to reject the null hypothesis because the P-value is less than or equal to the significance level, a. O C. Fail to reject the null hypothesis because the P-value is greater than the significance level, a. O D. Reject the null hypothesis because the P-value is less than or equal to the significance level, a. What is the final conclusion? O A. There is not sufficient evidence to support the claim that less than 25% of offspring peas will be yellow. O B. There is not sufficient evidence to warrant rejection of the claim that 25% of offspring peas will be yellow. OC. There is sufficient evidence to support the claim that less than 25% of offspring peas will be yellow. O D. There is sufficient evidence to warrant rejection of the claim that 25% of offspring peas will be yellow.

MATLAB: An Introduction with Applications
6th Edition
ISBN:9781119256830
Author:Amos Gilat
Publisher:Amos Gilat
Chapter1: Starting With Matlab
Section: Chapter Questions
Problem 1P

Related questions

Topic Video
Question
100%
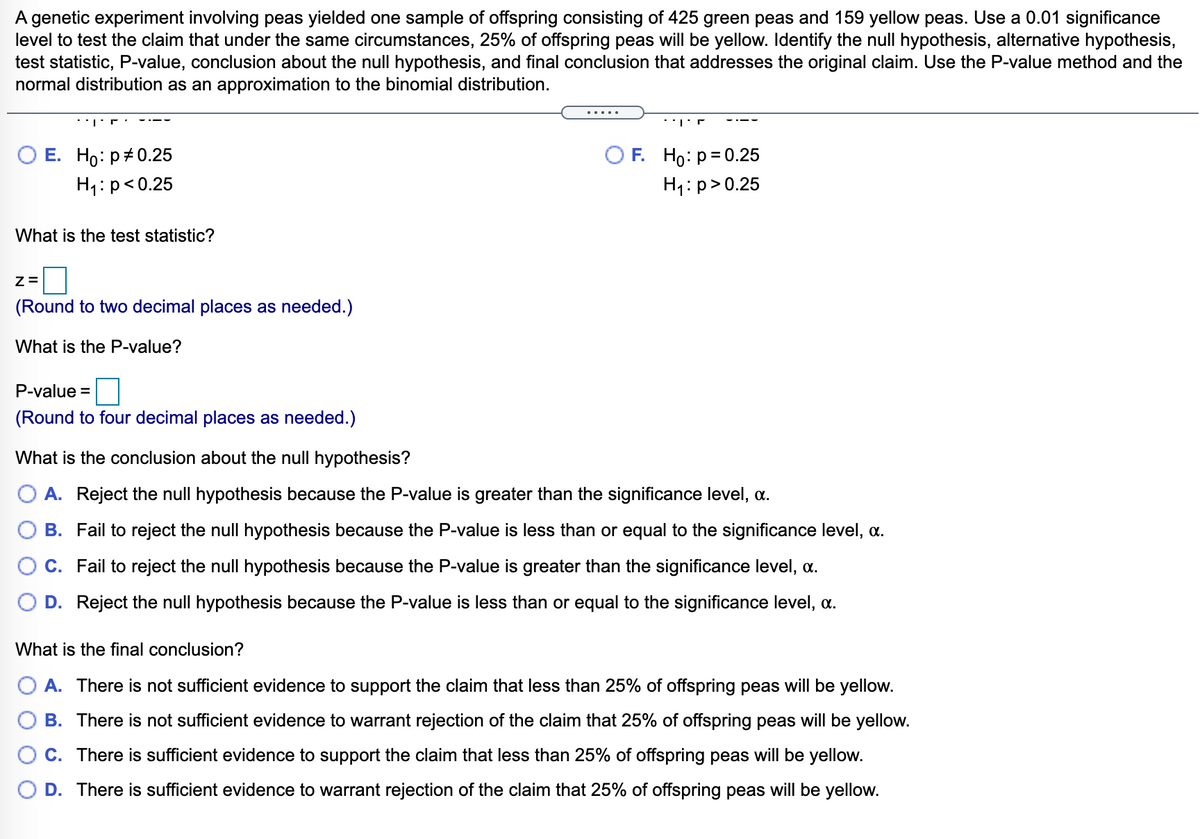
Transcribed Image Text:A genetic experiment involving peas yielded one sample of offspring consisting of 425 green peas and 159 yellow peas. Use a 0.01 significance
level to test the claim that under the same circumstances, 25% of offspring peas will be yellow. Identify the null hypothesis, alternative hypothesis,
test statistic, P-value, conclusion about the null hypothesis, and final conclusion that addresses the original claim. Use the P-value method and the
normal distribution as an approximation to the binomial distribution.
O E. Ho: p+0.25
O F. Ho: p= 0.25
H1: p<0.25
H1:p>0.25
What is the test statistic?
(Round to two decimal places as needed.)
What is the P-value?
P-value =
(Round to four decimal places as needed.)
What is the conclusion about the null hypothesis?
A. Reject the null hypothesis because the P-value is greater than the significance level, a.
B. Fail to reject the null hypothesis because the P-value is less than or equal to the significance level, a.
C. Fail to reject the null hypothesis because the P-value is greater than the significance level, a.
D. Reject the null hypothesis because the P-value is less than or equal to the significance level, a.
What is the final conclusion?
A. There is not sufficient evidence to support the claim that less than 25% of offspring peas will be yellow.
B. There is not sufficient evidence to warrant rejection of the claim that 25% of offspring peas will be yellow.
C. There is sufficient evidence to support the claim that less than 25% of offspring peas will be yellow.
O D. There is sufficient evidence to warrant rejection of the claim that 25% of offspring peas will be yellow.
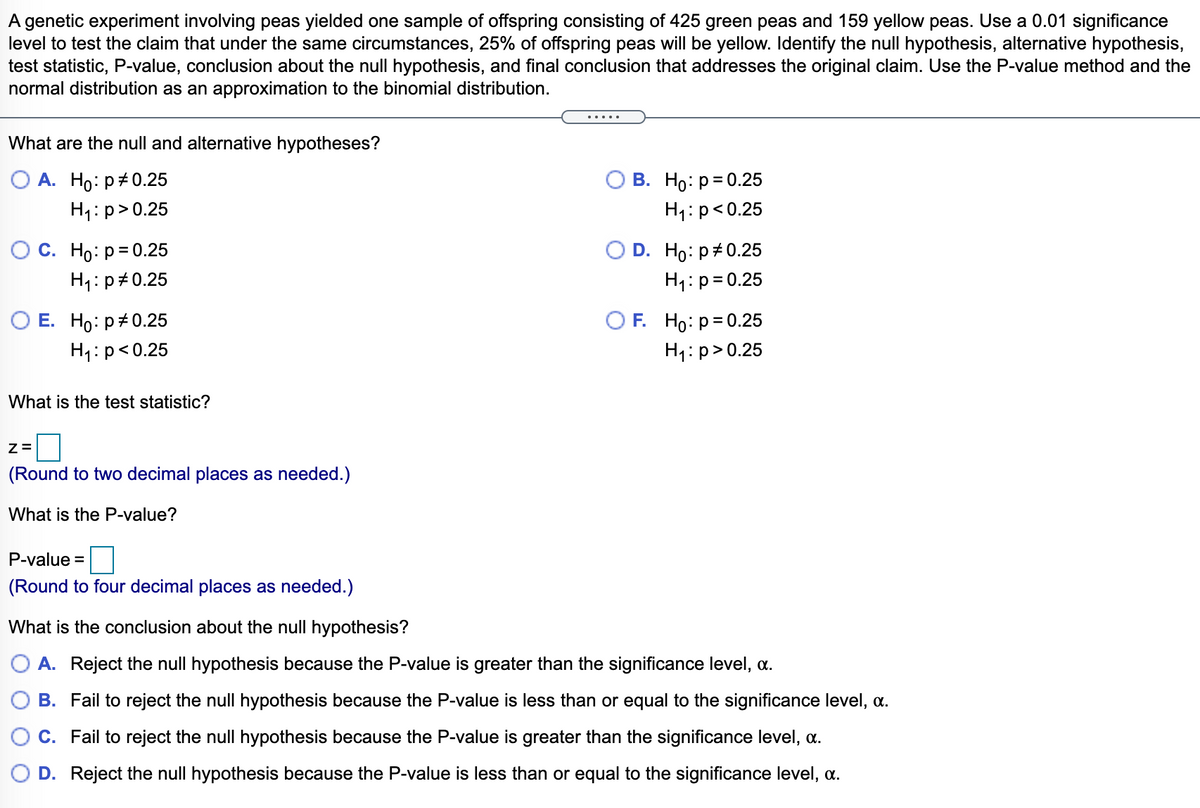
Transcribed Image Text:A genetic experiment involving peas yielded one sample of offspring consisting of 425 green peas and 159 yellow peas. Use a 0.01 significance
level to test the claim that under the same circumstances, 25% of offspring peas will be yellow. Identify the null hypothesis, alternative hypothesis,
test statistic, P-value, conclusion about the null hypothesis, and final conclusion that addresses the original claim. Use the P-value method and the
normal distribution as an approximation to the binomial distribution.
What are the null and alternative hypotheses?
О А. Но: р#0.25
В. Но р30.25
H1: p>0.25
H1: p<0.25
Ос. Но: р30.25
O D. Ho: р#0.25
H1: p#0.25
H1:p=0.25
%3D
ОЕ. Но: р#0.25
OF. Ho: p=0.25
H1: p> 0.25
H1:p<0.25
What is the test statistic?
(Round to two decimal places as needed.)
What is the P-value?
P-value =
(Round to four decimal places as needed.)
What is the conclusion about the null hypothesis?
O A. Reject the null hypothesis because the P-value is greater than the significance level, a.
B. Fail to reject the null hypothesis because the P-value is less than or equal to the significance level, a.
C. Fail to reject the null hypothesis because the P-value is greater than the significance level, a.
D. Reject the null hypothesis because the P-value is less than or equal to the significance level, a.
Expert Solution
This question has been solved!
Explore an expertly crafted, step-by-step solution for a thorough understanding of key concepts.

This is a popular solution!

Trending now
This is a popular solution!

Step by step
Solved in 4 steps

Knowledge Booster


Learn more about
Need a deep-dive on the concept behind this application? Look no further. Learn more about this topic, statistics and related others by exploring similar questions and additional content below.Recommended textbooks for you
MATLAB: An Introduction with Applications
Statistics
ISBN:
9781119256830
Author:
Amos Gilat
Publisher:
John Wiley & Sons Inc

Probability and Statistics for Engineering and th…
Statistics
ISBN:
9781305251809
Author:
Jay L. Devore
Publisher:
Cengage Learning

Statistics for The Behavioral Sciences (MindTap C…
Statistics
ISBN:
9781305504912
Author:
Frederick J Gravetter, Larry B. Wallnau
Publisher:
Cengage Learning
MATLAB: An Introduction with Applications
Statistics
ISBN:
9781119256830
Author:
Amos Gilat
Publisher:
John Wiley & Sons Inc
Probability and Statistics for Engineering and th…
Statistics
ISBN:
9781305251809
Author:
Jay L. Devore
Publisher:
Cengage Learning
Statistics for The Behavioral Sciences (MindTap C…
Statistics
ISBN:
9781305504912
Author:
Frederick J Gravetter, Larry B. Wallnau
Publisher:
Cengage Learning

Elementary Statistics: Picturing the World (7th E…
Statistics
ISBN:
9780134683416
Author:
Ron Larson, Betsy Farber
Publisher:
PEARSON

The Basic Practice of Statistics
Statistics
ISBN:
9781319042578
Author:
David S. Moore, William I. Notz, Michael A. Fligner
Publisher:
W. H. Freeman

Introduction to the Practice of Statistics
Statistics
ISBN:
9781319013387
Author:
David S. Moore, George P. McCabe, Bruce A. Craig
Publisher:
W. H. Freeman