Suppose a survey of 895 college students who were asked about their smoking behavior. Of the students surveyed, 264 cdlassified themselves as nonsmokers, but said "yes" when asked later in the survey if they smoked. These students were classified as "phantom smokers," meaning that they did not view themselves as smokers even though they do smoke at times. The authors were interested in using these data to determine if there is convincing evidence that more than 25% of college students fall into the phantom smoker category. Suppose that the sample of 895 college students can be regarded as representative of college students in the United States. (a) What hypotheses would you test to answer the question posed? O H: p< 0.25 versus H: p > 0.25 O Ho:p = 0.25 versus H: p< 0.25 O H: p = 0.25 versus H: p> 0.25 O H:p = 0.25 versus H: p= 0.25 O H:p+ 0.25 versus H: p = 0.25 (b) Is the sample size large enough for a large-sample test for a population proportion to be appropriate? O Yes O No (c) What is the value of the test statistic and the associated P-value for this test? (Use a table Round your test statistic to two decimal places and your P-value to four decimal places.) P-value - (d) If a significance level of 0.05 were chosen, would you reject the null hypothesis or fail to reject the null hypothesis? O Reject Ho- O Fail to reject Ho-
Suppose a survey of 895 college students who were asked about their smoking behavior. Of the students surveyed, 264 cdlassified themselves as nonsmokers, but said "yes" when asked later in the survey if they smoked. These students were classified as "phantom smokers," meaning that they did not view themselves as smokers even though they do smoke at times. The authors were interested in using these data to determine if there is convincing evidence that more than 25% of college students fall into the phantom smoker category. Suppose that the sample of 895 college students can be regarded as representative of college students in the United States. (a) What hypotheses would you test to answer the question posed? O H: p< 0.25 versus H: p > 0.25 O Ho:p = 0.25 versus H: p< 0.25 O H: p = 0.25 versus H: p> 0.25 O H:p = 0.25 versus H: p= 0.25 O H:p+ 0.25 versus H: p = 0.25 (b) Is the sample size large enough for a large-sample test for a population proportion to be appropriate? O Yes O No (c) What is the value of the test statistic and the associated P-value for this test? (Use a table Round your test statistic to two decimal places and your P-value to four decimal places.) P-value - (d) If a significance level of 0.05 were chosen, would you reject the null hypothesis or fail to reject the null hypothesis? O Reject Ho- O Fail to reject Ho-

Glencoe Algebra 1, Student Edition, 9780079039897, 0079039898, 2018
18th Edition
ISBN:9780079039897
Author:Carter
Publisher:Carter
Chapter4: Equations Of Linear Functions
Section: Chapter Questions
Problem 8SGR

Related questions

Concept explainers
Transformation of Graphs
The word ‘transformation’ means modification. Transformation of the graph of a function is a process by which we modify or change the original graph and make a new graph.
Exponential Functions
The exponential function is a type of mathematical function which is used in real-world contexts. It helps to find out the exponential decay model or exponential growth model, in mathematical models. In this topic, we will understand descriptive rules, concepts, structures, graphs, interpreter series, work formulas, and examples of functions involving exponents.
Question
need help with c and d only
Transcribed Image Text:4.
DETAILS
PECKSTAT2COREQ 10.R.092.S.
MY NOTES
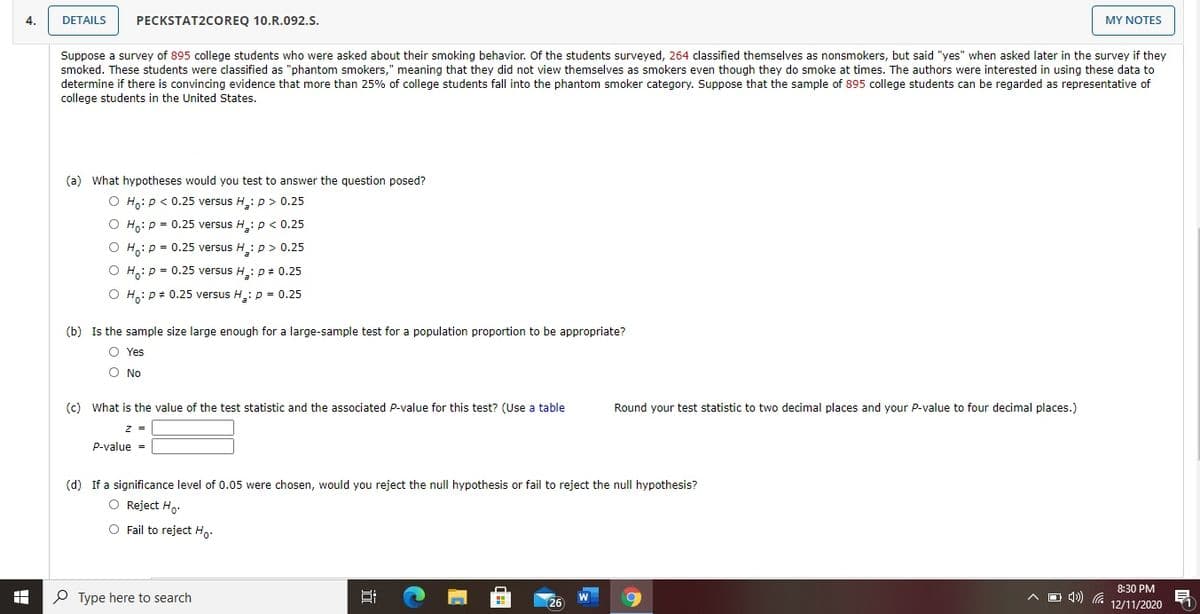
Suppose a survey of 895 college students who were asked about their smoking behavior. Of the students surveyed, 264 classified themselves as nonsmokers, but said "yes" when asked later in the survey if they
smoked. These students were classified as "phantom smokers," meaning that they did not view themselves as smokers even though they do smoke at times. The authors were interested in using these data to
determine if there is convincing evidence that more than 25% of college students fall into the phantom smoker category. Suppose that the sample of 895 college students can be regarded as representative of
college students in the United States.
(a) What hypotheses would you test to answer the question posed?
O Ho: p < 0.25 versus H.: p > 0.25
O Ho: p = 0.25 versus H: p < 0.25
O H,: p = 0.25 versus H: p > 0.25
H:p = 0.25 versus H: p+ 0.25
O H.: p+ 0.25 versus H: p = 0.25
(b) Is the sample size large enough for a large-sample test for a population proportion to be appropriate?
O Yes
O No
(c) What is the value of the test statistic and the associated P-value for this test? (Use a table
Round your test statistic to two decimal places and your P-value to four decimal places.)
z =
p-value =
(d) If a significance level of 0.05 were chosen, would you reject the null hypothesis or fail to reject the null hypothesis?
O Reject Ho.
O Fail to reject Ho.
8:30 PM
O Type here to search
O 4) G
W
26
12/11/2020
Expert Solution
This question has been solved!
Explore an expertly crafted, step-by-step solution for a thorough understanding of key concepts.

This is a popular solution!

Trending now
This is a popular solution!

Step by step
Solved in 4 steps

Knowledge Booster


Learn more about
Need a deep-dive on the concept behind this application? Look no further. Learn more about this topic, statistics and related others by exploring similar questions and additional content below.Recommended textbooks for you
Glencoe Algebra 1, Student Edition, 9780079039897…
Algebra
ISBN:
9780079039897
Author:
Carter
Publisher:
McGraw Hill
Glencoe Algebra 1, Student Edition, 9780079039897…
Algebra
ISBN:
9780079039897
Author:
Carter
Publisher:
McGraw Hill