A magazine publishes restaurant ratings for various locations around the world. The magazine rates the restaurants for food, decor, service, and the cost per person. Develop a regression model to predict the cost per person, based on a variable that represents the sum of the three ratings. The magazine has compiled the accompanying table of this summated ratings variable and the cost per person for 25 restaurants in a major city. Complete parts (a) through (e) below. E Click the lcon to view the table of summated ratings and cost per person. a. Construct a scatter plot. Choose the correct graph below. OA. OB. Oc. OD. ACost d 90 A Cost () ACost () 904 ACost ) 90 90 Rating Rating Rating Ratng Summated ratings and cost per person b. Assuming a linear relationship, use the least-squares method to compute the regression coefficients bo and b. bo -Oand b, -O (Round to two decimal places as needed.) Summated Rating Cost ($ per person) 53 67 67 c. Interpret the meaning of the Y-intercept, bo, and the slope, b,. Choose the correct answer below. 37 52 O A. The Y-intercept, bg. implies that if the summated rating of a restaurant is zero, the cost per person is bo, in dollars. The slope, b, implies the average cost per person is b; dollars. 61 OB. The Yintercept, bg, implies that if the summated rating of a restaurant is zero, the cost per meal is equal to bo, in dollars. The slope, b,, implies that for each increase of 1dollar in the cost per person, the summated rating is expected to increase by b, 66 58 66 45 OC. The Y-intercept, bg. implies that if the summated rating of a restaurant is zero, the cost per meal is equal to bo, in dollars. The slope, b,, implies that for each increase of 1 in the summated rating, the cost per person is expected to decrease by by, in dollars. 58 39 OD. Apractical interpretation of the Y-intercept bo is not meaningful because no operating restaurant is likely to have a rating of zero. The slope b, implies that for each increase of 1 in the summated rating, the cost per person is expected to increase by the value of 55 44 61 44 54 51 33 d. Predict the mean cost per person for a restaurant with a summated rating of 50. 35 50 41 Y, -$ per person (Round to the nearest cent as needed.) 50 77 37 83 e. What should you tell the owner of a group of restaurants in this geographical area about the relationship between the summated rating and the cost of a meal? 64 54 52 38 O A. As expected, the lower the summated rating of the restaurant, the higher the restaurant can charge per meal. OB. As expected, the higher the summated rating of the restaurant, the higher the restaurant can charge per meal. OC. As expected, the higher the summated rating of the restaurant, the less the restaurant can charge per meal. OD. As expected, the summated rating of the restaurant is not associated with what the restaurant can charge per meal. 48 37 55 48 31 23 55 43 58 45 63 64 63 63 51 28 74 45
A magazine publishes restaurant ratings for various locations around the world. The magazine rates the restaurants for food, decor, service, and the cost per person. Develop a regression model to predict the cost per person, based on a variable that represents the sum of the three ratings. The magazine has compiled the accompanying table of this summated ratings variable and the cost per person for 25 restaurants in a major city. Complete parts (a) through (e) below. E Click the lcon to view the table of summated ratings and cost per person. a. Construct a scatter plot. Choose the correct graph below. OA. OB. Oc. OD. ACost d 90 A Cost () ACost () 904 ACost ) 90 90 Rating Rating Rating Ratng Summated ratings and cost per person b. Assuming a linear relationship, use the least-squares method to compute the regression coefficients bo and b. bo -Oand b, -O (Round to two decimal places as needed.) Summated Rating Cost ($ per person) 53 67 67 c. Interpret the meaning of the Y-intercept, bo, and the slope, b,. Choose the correct answer below. 37 52 O A. The Y-intercept, bg. implies that if the summated rating of a restaurant is zero, the cost per person is bo, in dollars. The slope, b, implies the average cost per person is b; dollars. 61 OB. The Yintercept, bg, implies that if the summated rating of a restaurant is zero, the cost per meal is equal to bo, in dollars. The slope, b,, implies that for each increase of 1dollar in the cost per person, the summated rating is expected to increase by b, 66 58 66 45 OC. The Y-intercept, bg. implies that if the summated rating of a restaurant is zero, the cost per meal is equal to bo, in dollars. The slope, b,, implies that for each increase of 1 in the summated rating, the cost per person is expected to decrease by by, in dollars. 58 39 OD. Apractical interpretation of the Y-intercept bo is not meaningful because no operating restaurant is likely to have a rating of zero. The slope b, implies that for each increase of 1 in the summated rating, the cost per person is expected to increase by the value of 55 44 61 44 54 51 33 d. Predict the mean cost per person for a restaurant with a summated rating of 50. 35 50 41 Y, -$ per person (Round to the nearest cent as needed.) 50 77 37 83 e. What should you tell the owner of a group of restaurants in this geographical area about the relationship between the summated rating and the cost of a meal? 64 54 52 38 O A. As expected, the lower the summated rating of the restaurant, the higher the restaurant can charge per meal. OB. As expected, the higher the summated rating of the restaurant, the higher the restaurant can charge per meal. OC. As expected, the higher the summated rating of the restaurant, the less the restaurant can charge per meal. OD. As expected, the summated rating of the restaurant is not associated with what the restaurant can charge per meal. 48 37 55 48 31 23 55 43 58 45 63 64 63 63 51 28 74 45

Functions and Change: A Modeling Approach to College Algebra (MindTap Course List)
6th Edition
ISBN:9781337111348
Author:Bruce Crauder, Benny Evans, Alan Noell
Publisher:Bruce Crauder, Benny Evans, Alan Noell
Chapter3: Straight Lines And Linear Functions
Section3.CR: Chapter Review Exercises
Problem 15CR: Life Expectancy The following table shows the average life expectancy, in years, of a child born in...

Related questions
Question
D and E please
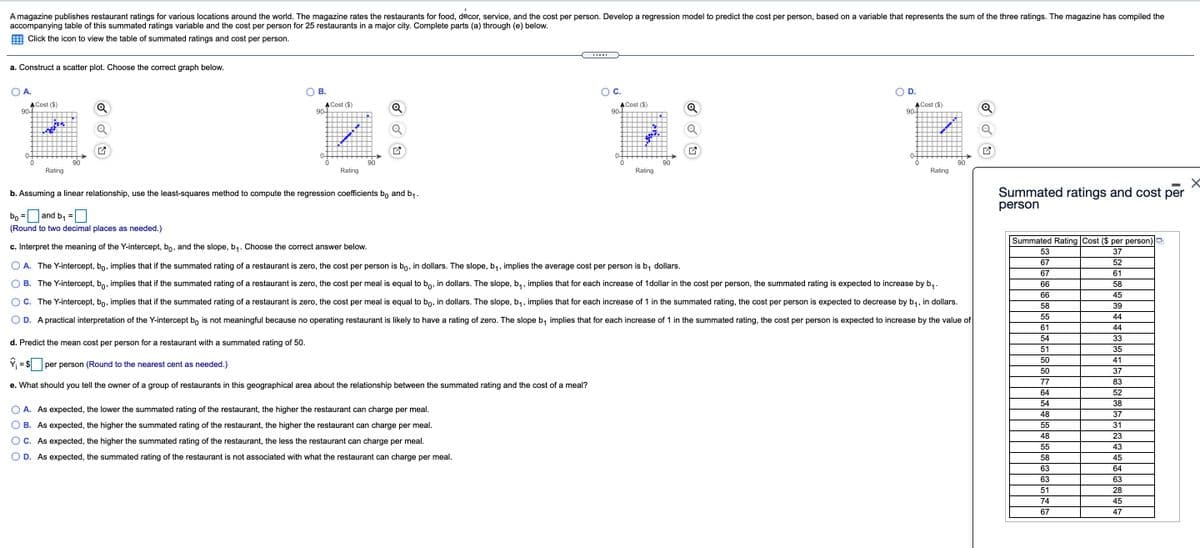
Transcribed Image Text:A magazine publishes restaurant ratings for various locations around the world. The magazine rates the restaurants for food, decor, service, and the cost per person. Develop a regression model to predict the cost per person, based on a variable that represents the sum of the three ratings. The magazine has compiled the
accompanying table of this summated ratings variable and the cost per person for 25 restaurants in a major city. Complete parts (a) through (e) below.
Click the icon to view the table of summated ratings and cost per person.
a. Construct a scatter plot. Choose the correct graph below.
O A.
Ов.
OC.
OD.
ACost ($)
90-
Q
A Cost ($)
904
A Cost ($)
90-
ACost ($)
90-
0-
0-
0-
0-
90
Rating
90
Rating
90
90
Rating
Rating
Summated ratings and cost per
person
b. Assuming a linear relationship, use the least-squares method to compute the regression coefficients bo and b,.
bo =D and b, =O
(Round to two decimal places as needed.)
Summated Rating Cost ($ per person)|9
c. Interpret the meaning of the Y-intercept, bo, and the slope, b,. Choose the correct answer below.
53
37
67
52
A. The Y-intercept, bo, implies that if the summated rating of a restaurant is zero, the cost per person is bo, in dollars. The slope, b,, implies the average cost per person is b, dollars.
67
61
O B. The Y-intercept, bo, implies that if the summated rating of a restaurant is zero, the cost per meal is equal to bo, in dollars. The slope, b, , implies that for each increase of 1dollar in the cost per person, the summated rating is expected to increase by b,.
66
58
1:
66
45
OC. The Y-intercept, bo, implies that if the summated rating of a restaurant is zero, the cost per meal is equal to bo, in dollars. The slope, b1, implies that for each increase of 1 in the summated rating, the cost per person is expected to decrease by b,, in dollars.
58
39
55
44
O D. A practical interpretation of the Y-intercept bo is not meaningful because no operating restaurant is likely to have a rating of zero. The slope b, implies that for each increase of 1 in the summated rating, the cost per person is expected to increase by the value of
61
44
54
33
d. Predict the mean cost per person for a restaurant with a summated rating of 50.
51
35
50
41
= $ per person (R
to the nearest cent as needed.)
50
37
77
83
e. What should you tell the owner of a group of restaurants in this geographical area about the relationship between the summated rating and the cost of a meal?
64
52
54
38
A. As expected, the lower the summated rating of the restaurant, the higher the restaurant can charge per meal.
48
37
O B. As expected, the higher the summated rating of the restaurant, the higher the restaurant can charge per meal.
55
31
48
23
C. As expected, the higher the summated rating of the restaurant, the less the restaurant can charge per meal.
55
43
O D. As expected, the summated rating of the restaurant is not associated with what the restaurant can charge per meal.
58
45
63
64
63
63
51
28
74
45
67
47
Expert Solution
This question has been solved!
Explore an expertly crafted, step-by-step solution for a thorough understanding of key concepts.

This is a popular solution!

Trending now
This is a popular solution!

Step by step
Solved in 2 steps with 2 images

Recommended textbooks for you
Functions and Change: A Modeling Approach to Coll…
Algebra
ISBN:
9781337111348
Author:
Bruce Crauder, Benny Evans, Alan Noell
Publisher:
Cengage Learning

Algebra and Trigonometry (MindTap Course List)
Algebra
ISBN:
9781305071742
Author:
James Stewart, Lothar Redlin, Saleem Watson
Publisher:
Cengage Learning

Functions and Change: A Modeling Approach to Coll…
Algebra
ISBN:
9781337111348
Author:
Bruce Crauder, Benny Evans, Alan Noell
Publisher:
Cengage Learning
Algebra and Trigonometry (MindTap Course List)
Algebra
ISBN:
9781305071742
Author:
James Stewart, Lothar Redlin, Saleem Watson
Publisher:
Cengage Learning

Glencoe Algebra 1, Student Edition, 9780079039897…
Algebra
ISBN:
9780079039897
Author:
Carter
Publisher:
McGraw Hill

Algebra & Trigonometry with Analytic Geometry
Algebra
ISBN:
9781133382119
Author:
Swokowski
Publisher:
Cengage

Big Ideas Math A Bridge To Success Algebra 1: Stu…
Algebra
ISBN:
9781680331141
Author:
HOUGHTON MIFFLIN HARCOURT
Publisher:
Houghton Mifflin Harcourt