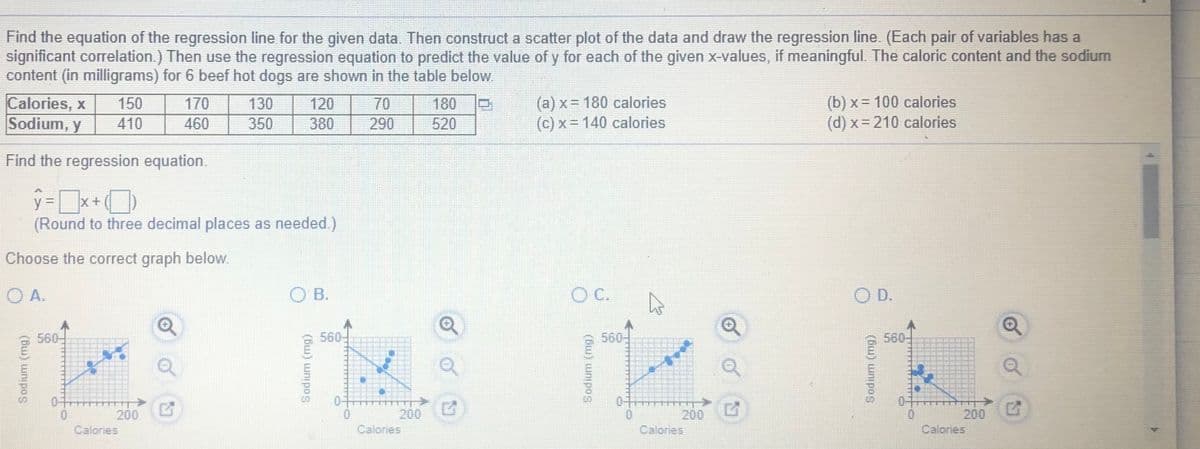
Find the equation of the regression line for the given data. Then construct a scatter plot of the data and draw the regression line. (Each pair of variables has a significant correlation.) Then use the regression equation to predict the value of y for each of the given x-values, if meaningful. The caloric content and the sodium content (in milligrams) for 6 beef hot dogs are shown in the table below. Calories, x Sodium, y 150 410 120 380 (b) x= 100 calories (d) x= 210 calories 130 180 520 (a) x = 180 calories (c) x = 140 calories 170 70 460 350 290 Find the regression equation. (Round to three decimal places as needed.) Choose the correct graph below. O A. O B. O D. 560 560 560 560 200 G 200 200 Calories 200 Calories Calories Calories w) unipos ) unipos


Correlation
Correlation defines a relationship between two independent variables. It tells the degree to which variables move in relation to each other. When two sets of data are related to each other, there is a correlation between them.
Linear Correlation
A correlation is used to determine the relationships between numerical and categorical variables. In other words, it is an indicator of how things are connected to one another. The correlation analysis is the study of how variables are related.
Regression Analysis
Regression analysis is a statistical method in which it estimates the relationship between a dependent variable and one or more independent variable. In simple terms dependent variable is called as outcome variable and independent variable is called as predictors. Regression analysis is one of the methods to find the trends in data. The independent variable used in Regression analysis is named Predictor variable. It offers data of an associated dependent variable regarding a particular outcome.

Step by step
Solved in 4 steps with 3 images


