1. A manufacturing company is interested in predicting the number of defects that will be produced each hour on the assembly line. The managers believe that there is a relationship between the defect rate and the production rate per hour. The managers believe that they can use production rate to predict the number of defects. The following data were collected for 8 randomly selected hours. Defects Production rate/h 2 3 1 2 3 5 40 45 20 35 40 50 30 50 e. At a significance level of .01 can you conclude that production rate is a good predictor of the number defects?
1. A manufacturing company is interested in predicting the number of defects that will be produced each hour on the assembly line. The managers believe that there is a relationship between the defect rate and the production rate per hour. The managers believe that they can use production rate to predict the number of defects. The following data were collected for 8 randomly selected hours. Defects Production rate/h 2 3 1 2 3 5 40 45 20 35 40 50 30 50 e. At a significance level of .01 can you conclude that production rate is a good predictor of the number defects?

College Algebra (MindTap Course List)
12th Edition
ISBN:9781305652231
Author:R. David Gustafson, Jeff Hughes
Publisher:R. David Gustafson, Jeff Hughes
Chapter8: Sequences, Series, And Probability
Section8.7: Probability
Problem 58E: What is meant by the sample space of an experiment?

Related questions
Question
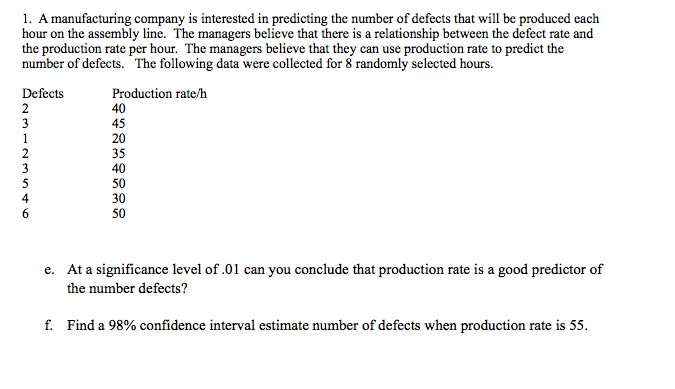
Transcribed Image Text:1. A manufacturing company is interested in predicting the number of defects that will be produced each
hour on the assembly line. The managers believe that there is a relationship between the defect rate and
the production rate per hour. The managers believe that they can use production rate to predict the
number of defects. The following data were collected for 8 randomly selected hours.
Defects
2
3
1
Production rate/h
40
45
20
35
40
50
30
50
3
5
4
e. At a significance level of .01 can you conclude that production rate is a good predictor of
the number defects?
f. Find a 98% confidence interval estimate number of defects when production rate is 55.
Expert Solution
This question has been solved!
Explore an expertly crafted, step-by-step solution for a thorough understanding of key concepts.

This is a popular solution!

Trending now
This is a popular solution!

Step by step
Solved in 2 steps with 2 images

Follow-up Questions
Read through expert solutions to related follow-up questions below.
Recommended textbooks for you
College Algebra (MindTap Course List)
Algebra
ISBN:
9781305652231
Author:
R. David Gustafson, Jeff Hughes
Publisher:
Cengage Learning
College Algebra (MindTap Course List)
Algebra
ISBN:
9781305652231
Author:
R. David Gustafson, Jeff Hughes
Publisher:
Cengage Learning