A marketing expert for a pasta-making company believes that 40% of pasta lovers prefer lasagna. If 13 out of 20 pasta lovers choose lasagna over other pastas, what can be concluded about the expert's claim? Use a 0.10 level significance. Click here to view the binomial probability sums table for n=17 and n=18. Click here to view the binomial probability sums table for n=19 and n=20 Let a success be a pasta lover that chooses lasagna over other pastas. Identify the null and alternative hypotheses. O A. Ho p<0.4 O B. H, p=0.4 O C. Ho p>0.4 H, p=04 H1: p=0.4 H, p>04 O D. Ho p=0.4 VE. Ho: P=0.4 OF. H, p 0.4 H, p= 0.4 H, p<0.4 H, p#0.4 The test statistic is a binomial variable X with p= 13 andn=29 (Type integers or decimals. Do not round.)
A marketing expert for a pasta-making company believes that 40% of pasta lovers prefer lasagna. If 13 out of 20 pasta lovers choose lasagna over other pastas, what can be concluded about the expert's claim? Use a 0.10 level significance. Click here to view the binomial probability sums table for n=17 and n=18. Click here to view the binomial probability sums table for n=19 and n=20 Let a success be a pasta lover that chooses lasagna over other pastas. Identify the null and alternative hypotheses. O A. Ho p<0.4 O B. H, p=0.4 O C. Ho p>0.4 H, p=04 H1: p=0.4 H, p>04 O D. Ho p=0.4 VE. Ho: P=0.4 OF. H, p 0.4 H, p= 0.4 H, p<0.4 H, p#0.4 The test statistic is a binomial variable X with p= 13 andn=29 (Type integers or decimals. Do not round.)

MATLAB: An Introduction with Applications
6th Edition
ISBN:9781119256830
Author:Amos Gilat
Publisher:Amos Gilat
Chapter1: Starting With Matlab
Section: Chapter Questions
Problem 1P

Related questions
Question
I only want the correct answer for the 2 questions it’s very urgent!!! Please Thank you
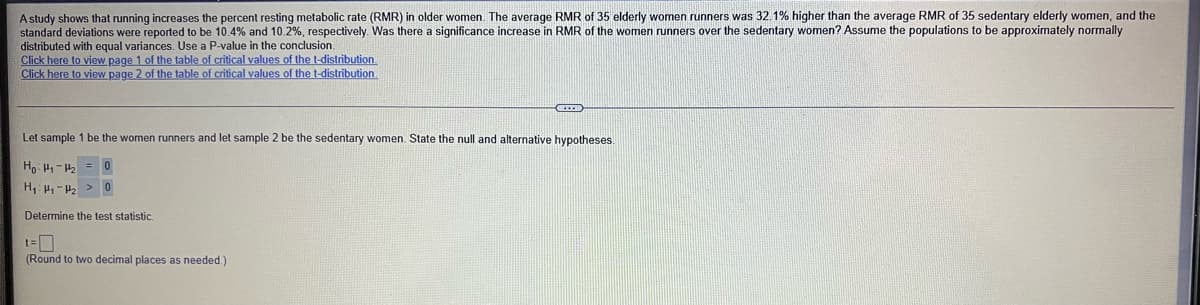
Transcribed Image Text:A study shows that running increases the percent resting metabolic rate (RMR) in older women. The average RMR of 35 elderly women runners was 32.1% higher than the average RMR of 35 sedentary elderly women, and the
standard deviations were reported to be 10.4% and 10.2%, respectively. Was there a significance increase in RMR of the women runners over the sedentary women? Assume the populations to be approximately normally
distributed with equal variances. Use a P-value in the conclusion.
Click here to view page 1 of the table of critical values of the t-distribution
Click here to view page 2 of the table of critical values of the t-distribution
Let sample 1 be the women runners and let sample 2 be the sedentary women. State the null and alternative hypotheses.
Ho: H- = 0
H H-2 >0
Determine the test statistic.
(Round to two decimal places as needed.)
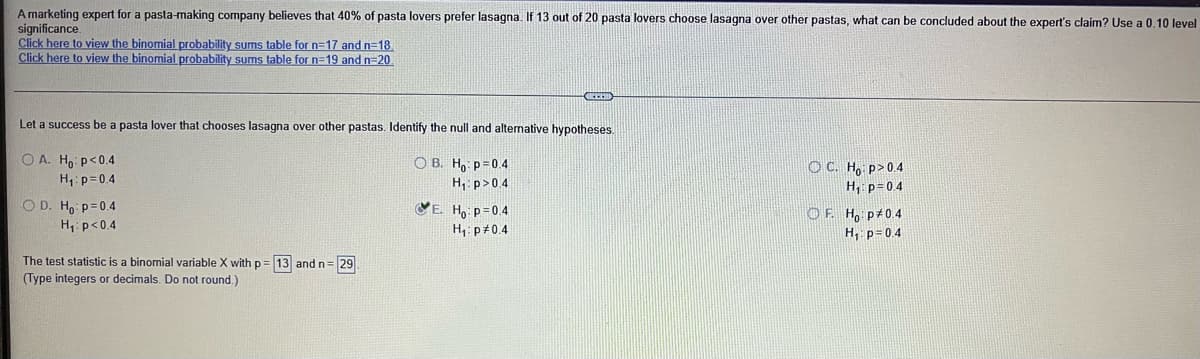
Transcribed Image Text:A marketing expert for a pasta-making company believes that 40% of pasta lovers prefer lasagna. If 13 out of 20 pasta lovers choose lasagna over other pastas, what can be concluded about the expert's claim? Use a 0,10 level
significance.
Click here to view the binomial probability sums table for n=17 and n=18
Click here to view the binomial probability sums table for n=19 and n=20
Let a success be a pasta lover that chooses lasagna over other pastas. Identify the null and alternative hypotheses.
O A. Ho p<0.4
O B. H, p=0.4
H, p>04
VE. Ho p=0.4
H, p#0.4
OC. H, p>0.4
H, p=04
H1: p=0.4
CO D. Ho p=0.4
OF. H, p 0.4
H, p=0.4
H, p<0.4
The test statistic is a binomial variable X with p= 13 andn=29
(Type integers or decimals. Do not round.)
Expert Solution
This question has been solved!
Explore an expertly crafted, step-by-step solution for a thorough understanding of key concepts.

This is a popular solution!

Trending now
This is a popular solution!

Step by step
Solved in 2 steps

Recommended textbooks for you
MATLAB: An Introduction with Applications
Statistics
ISBN:
9781119256830
Author:
Amos Gilat
Publisher:
John Wiley & Sons Inc

Probability and Statistics for Engineering and th…
Statistics
ISBN:
9781305251809
Author:
Jay L. Devore
Publisher:
Cengage Learning

Statistics for The Behavioral Sciences (MindTap C…
Statistics
ISBN:
9781305504912
Author:
Frederick J Gravetter, Larry B. Wallnau
Publisher:
Cengage Learning
MATLAB: An Introduction with Applications
Statistics
ISBN:
9781119256830
Author:
Amos Gilat
Publisher:
John Wiley & Sons Inc
Probability and Statistics for Engineering and th…
Statistics
ISBN:
9781305251809
Author:
Jay L. Devore
Publisher:
Cengage Learning
Statistics for The Behavioral Sciences (MindTap C…
Statistics
ISBN:
9781305504912
Author:
Frederick J Gravetter, Larry B. Wallnau
Publisher:
Cengage Learning

Elementary Statistics: Picturing the World (7th E…
Statistics
ISBN:
9780134683416
Author:
Ron Larson, Betsy Farber
Publisher:
PEARSON

The Basic Practice of Statistics
Statistics
ISBN:
9781319042578
Author:
David S. Moore, William I. Notz, Michael A. Fligner
Publisher:
W. H. Freeman

Introduction to the Practice of Statistics
Statistics
ISBN:
9781319013387
Author:
David S. Moore, George P. McCabe, Bruce A. Craig
Publisher:
W. H. Freeman