A medical researcher conducted an observational study to understand the recovery rate for patients infected with the COVID-19 in Malaysia. The researcher contacted thirteen COVID- 19 survivors and interviewed them regarding their recovery experience. Two of the questions asked are the recovery period (in days) and the number of days that have passed since receiving the second dose of COVID-19 vaccine prior to infection. The recorded data is summarized as (at the image files). iii) Estimate the regression model parameters and write the estimated linear regression model. ANS FOR iii) β1ˆ=0.018724 β0ˆ= 8.071748 yˆ= 8.0717+0.0187x iv) Based on your answer in iii), predict the recovery period if a person is infected with COVID-19 after 200 days of receiving second dose of COVID-19 vaccine. v) Table 1 represents the incomplete ANOVA table of the study. Find the values of P, Q, R and S. vi) Test the linearity between the two variables at 4% significance level.
A medical researcher conducted an observational study to understand the recovery rate for patients infected with the COVID-19 in Malaysia. The researcher contacted thirteen COVID- 19 survivors and interviewed them regarding their recovery experience. Two of the questions asked are the recovery period (in days) and the number of days that have passed since receiving the second dose of COVID-19 vaccine prior to infection. The recorded data is summarized as (at the image files). iii) Estimate the regression model parameters and write the estimated linear regression model. ANS FOR iii) β1ˆ=0.018724 β0ˆ= 8.071748 yˆ= 8.0717+0.0187x iv) Based on your answer in iii), predict the recovery period if a person is infected with COVID-19 after 200 days of receiving second dose of COVID-19 vaccine. v) Table 1 represents the incomplete ANOVA table of the study. Find the values of P, Q, R and S. vi) Test the linearity between the two variables at 4% significance level.

Algebra & Trigonometry with Analytic Geometry
13th Edition
ISBN:9781133382119
Author:Swokowski
Publisher:Swokowski
Chapter1: Fundamental Concepts Of Algebra
Section1.2: Exponents And Radicals
Problem 43E

Related questions
Question
100%
A medical researcher conducted an observational study to understand the recovery rate for
patients infected with the COVID-19 in Malaysia. The researcher contacted thirteen COVID-
19 survivors and interviewed them regarding their recovery experience. Two of the questions
asked are the recovery period (in days) and the number of days that have passed since receiving
the second dose of COVID-19 vaccine prior to infection. The recorded data is summarized as (at the image files).
iii) Estimate the regression model parameters and write the estimated linear regression
model.
ANS FOR iii)
β1ˆ=0.018724
β0ˆ= 8.071748
yˆ= 8.0717+0.0187x
- iv) Based on your answer in iii), predict the recovery period if a person is infected with
COVID-19 after 200 days of receiving second dose of COVID-19 vaccine. - v) Table 1 represents the incomplete ANOVA table of the study. Find the values of P, Q,
R and S. - vi) Test the linearity between the two variables at 4% significance level.
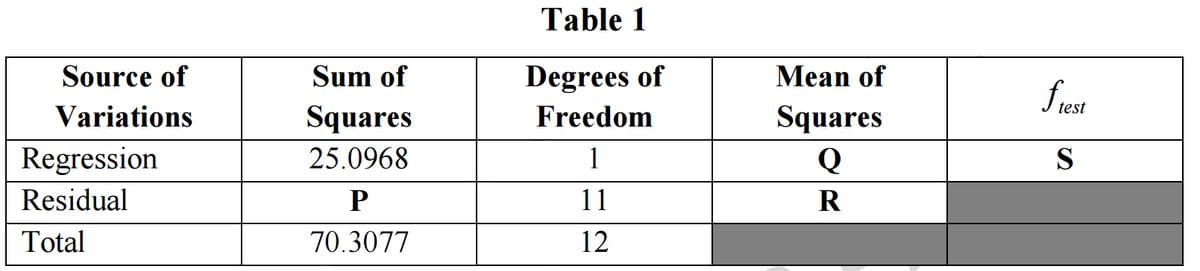
Transcribed Image Text:Table 1
Source of
Sum of
Degrees of
Mean of
fre
test
Variations
Squares
Freedom
Squares
Regression
25.0968
1
Q
S
Residual
P
11
R
Total
70.3077
12
Transcribed Image Text:Σx 1499, Σν13,
Σν- 133,
x* = 244523, y = 1431,
xy = 16678,
S = 71676.7692,
S = 70.3077,
S = 1342.0769
NX
XV
Expert Solution
This question has been solved!
Explore an expertly crafted, step-by-step solution for a thorough understanding of key concepts.

Step by step
Solved in 4 steps

Recommended textbooks for you
Algebra & Trigonometry with Analytic Geometry
Algebra
ISBN:
9781133382119
Author:
Swokowski
Publisher:
Cengage
Algebra & Trigonometry with Analytic Geometry
Algebra
ISBN:
9781133382119
Author:
Swokowski
Publisher:
Cengage