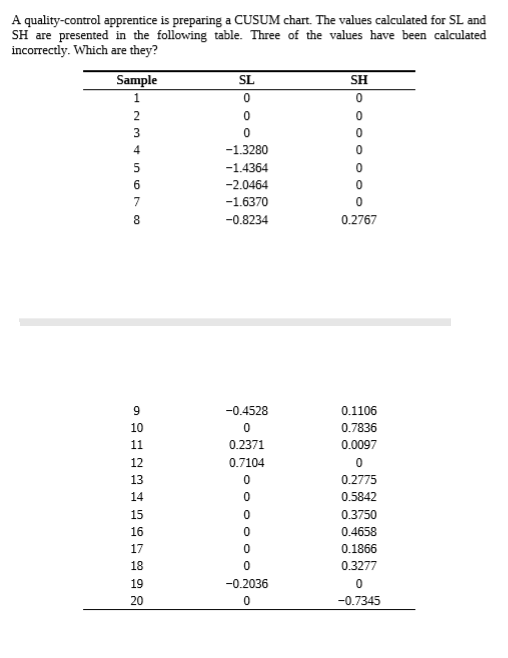
A quality-control apprentice is preparing a CUSUM chart. The values calculated for SL and SH are presented in the following table. Three of the values have been calculated incorrectly. Which are they? Sample SL SH 2 3 -1.3280 -1.4364 -2.0464 -1.6370 -0.8234 0.2767 -0.4528 0.1106 10 0.7836 11 0.2371 0.0097 12 0.7104 13 0.2775 14 0.5842 15 0.3750 16 0.4658 17 0.1866 18 0.3277 19 -0.2036 20 -0.7345
A quality-control apprentice is preparing a CUSUM chart. The values calculated for SL and SH are presented in the following table. Three of the values have been calculated incorrectly. Which are they? Sample SL SH 2 3 -1.3280 -1.4364 -2.0464 -1.6370 -0.8234 0.2767 -0.4528 0.1106 10 0.7836 11 0.2371 0.0097 12 0.7104 13 0.2775 14 0.5842 15 0.3750 16 0.4658 17 0.1866 18 0.3277 19 -0.2036 20 -0.7345

Glencoe Algebra 1, Student Edition, 9780079039897, 0079039898, 2018
18th Edition
ISBN:9780079039897
Author:Carter
Publisher:Carter
Chapter10: Statistics
Section10.5: Comparing Sets Of Data
Problem 13PPS

Related questions
Question
Transcribed Image Text:A quality-control apprentice is preparing a CUSUM chart. The values calculated for SL and
SH are presented in the following table. Three of the values have been calculated
incorrectly. Which are they?
Sample
SL
SH
2
3
-1.3280
-1.4364
-2.0464
-1.6370
-0.8234
0.2767
-0.4528
0.1106
10
0.7836
11
0.2371
0.0097
12
0.7104
13
0.2775
14
0.5842
15
0.3750
16
0.4658
17
0.1866
18
0.3277
19
-0.2036
20
-0.7345
Expert Solution
This question has been solved!
Explore an expertly crafted, step-by-step solution for a thorough understanding of key concepts.

Step by step
Solved in 2 steps

Recommended textbooks for you
Glencoe Algebra 1, Student Edition, 9780079039897…
Algebra
ISBN:
9780079039897
Author:
Carter
Publisher:
McGraw Hill
Glencoe Algebra 1, Student Edition, 9780079039897…
Algebra
ISBN:
9780079039897
Author:
Carter
Publisher:
McGraw Hill