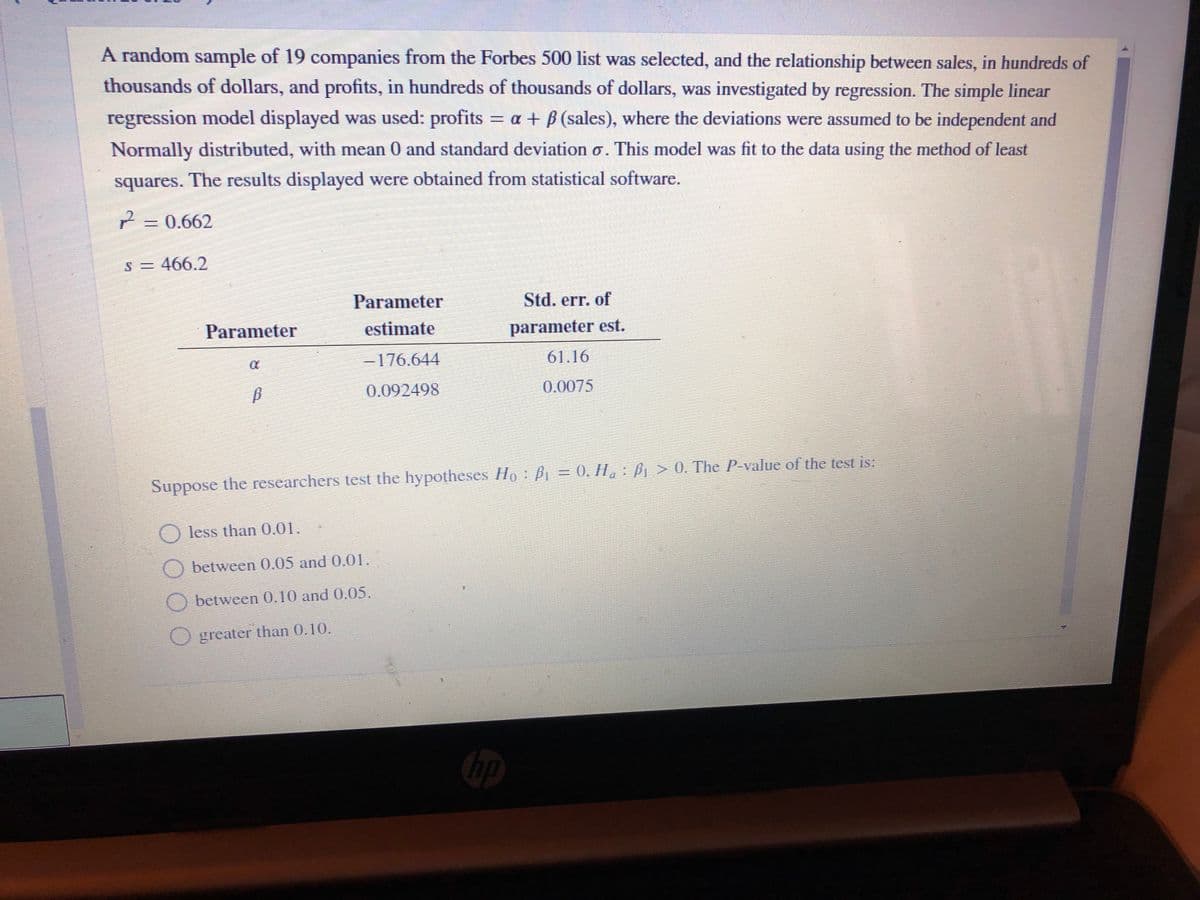
A random sample of 19 companies from the Forbes 500 list was selected, and the relationship between sales, in hundreds of thousands of dollars, and profits, in hundreds of thousands of dollars, was investigated by regression. The simple linear regression model displayed was used: profits = a + B (sales), where the deviations were assumed to be independent and Normally distributed, with mean 0 and standard deviation o. This model was fit to the data using the method of least squares. The results displayed were obtained from statistical software. 2 = 0.662 s = 466.2 Parameter Std. err. of Parameter estimate parameter est. -176.644 61.16 0.092498 0.0075 Suppose the researchers test the hypotheses Ho: B = 0, H: > 0. The P-value of the test is: less than 0.01.- O between 0.05 and 0.01. O between 0.10 and 0.05. O greater than 0.10. O O OO
A random sample of 19 companies from the Forbes 500 list was selected, and the relationship between sales, in hundreds of thousands of dollars, and profits, in hundreds of thousands of dollars, was investigated by regression. The simple linear regression model displayed was used: profits = a + B (sales), where the deviations were assumed to be independent and Normally distributed, with mean 0 and standard deviation o. This model was fit to the data using the method of least squares. The results displayed were obtained from statistical software. 2 = 0.662 s = 466.2 Parameter Std. err. of Parameter estimate parameter est. -176.644 61.16 0.092498 0.0075 Suppose the researchers test the hypotheses Ho: B = 0, H: > 0. The P-value of the test is: less than 0.01.- O between 0.05 and 0.01. O between 0.10 and 0.05. O greater than 0.10. O O OO

Linear Algebra: A Modern Introduction
4th Edition
ISBN:9781285463247
Author:David Poole
Publisher:David Poole
Chapter7: Distance And Approximation
Section7.3: Least Squares Approximation
Problem 31EQ

Related questions

Question
100%
Transcribed Image Text:A random sample of 19 companies from the Forbes 500 list was selected, and the relationship between sales, in hundreds of
thousands of dollars, and profits, in hundreds of thousands of dollars, was investigated by regression. The simple linear
regression model displayed was used: profits = a + B (sales), where the deviations were assumed to be independent and
Normally distributed, with mean 0 and standard deviation o. This model was fit to the data using the method of least
squares. The results displayed were obtained from statistical software.
2
= 0.662
S = 466.2
Parameter
Std. err. of
Parameter
estimate
parameter est.
-176.644
61.16
0.092498
0.0075
Suppose the researchers test the hypotheses Ho: P = 0, II, : A > 0. The P-value of the test is:
less than 0.01.
between 0.05 and 0.01.
O between 0.10 and 0.05.
greater than 0.10.
hp
Expert Solution
This question has been solved!
Explore an expertly crafted, step-by-step solution for a thorough understanding of key concepts.

This is a popular solution!

Trending now
This is a popular solution!

Step by step
Solved in 2 steps with 4 images

Knowledge Booster


Learn more about
Need a deep-dive on the concept behind this application? Look no further. Learn more about this topic, statistics and related others by exploring similar questions and additional content below.Recommended textbooks for you
Linear Algebra: A Modern Introduction
Algebra
ISBN:
9781285463247
Author:
David Poole
Publisher:
Cengage Learning

Glencoe Algebra 1, Student Edition, 9780079039897…
Algebra
ISBN:
9780079039897
Author:
Carter
Publisher:
McGraw Hill

Functions and Change: A Modeling Approach to Coll…
Algebra
ISBN:
9781337111348
Author:
Bruce Crauder, Benny Evans, Alan Noell
Publisher:
Cengage Learning
Linear Algebra: A Modern Introduction
Algebra
ISBN:
9781285463247
Author:
David Poole
Publisher:
Cengage Learning
Glencoe Algebra 1, Student Edition, 9780079039897…
Algebra
ISBN:
9780079039897
Author:
Carter
Publisher:
McGraw Hill
Functions and Change: A Modeling Approach to Coll…
Algebra
ISBN:
9781337111348
Author:
Bruce Crauder, Benny Evans, Alan Noell
Publisher:
Cengage Learning